


• The outlook for the iron ore and steel segment has improved slightly in the short term, with steel demand stabilising and apparent steel consumption expected to rebound in 2026. Supported by stronger prospects for the construction and automotive sectors, iron ore transport on the Rhine is forecast to recover modestly in 2026-2027. In contrast, mineral oil products face a negative outlook, as low water conditions, weaker heating oil demand, reduced incentives for stockpiling and the long-term energy transition are expected to constrain transport demand.
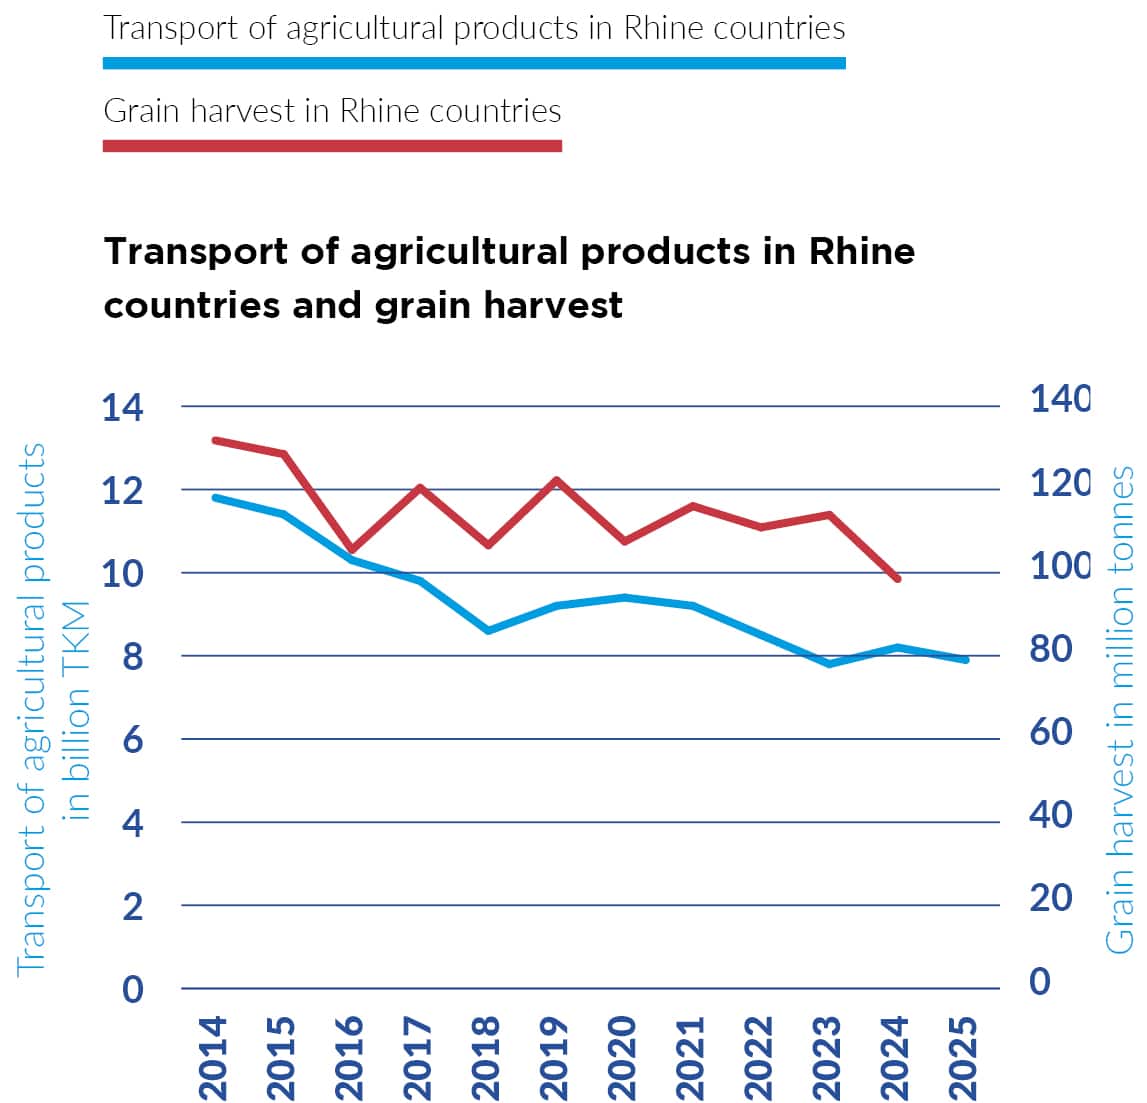
• Agricultural products benefited from strong harvests and export demand in 2025. In contrast, the chemical sector is expected to remain challenging in the short term due to weak demand, high energy costs and global competition. The output of the EU-27 chemical industry declined by -2.4% in 2025 compared to 2024. Container transport continues to face challenges from low water, geopolitical tensions, and logistical inefficiencies, with only moderate growth expected and at a slower pace than in the past.
• In the long run, production forecasts point to declining output for petroleum products, coal and steel in Rhine countries, while chemical production and international trade are expected to grow and support transport demand. Container transport is projected to benefit from growth in global trade over the long term.
SHORT-TERM OUTLOOK FOR IWT MARKETS IN RHINE AND DANUBE COUNTRIES
- Inland navigation is an important transport mode for raw materials and end products of the steel industry. In the German steel industry (the largest steel producing country in the EU), for example, inland navigation has a market share of approximately 32% among all logistic activities, according to the German Steel Association. This market share increased slightly in 2023 and 2024, although it shows a rather constant evolution since 2011, fluctuating around the 30% share.
- On the entire Rhine, 16.5% of all cargo transport is related to steel production (iron ore, coking coal, metals, metal products).55 For the traditional Rhine, this share is around 30% if an estimate for the share of scrap steel is added. On the Danube, the share is even higher and amounts to 40% for the middle Danube.
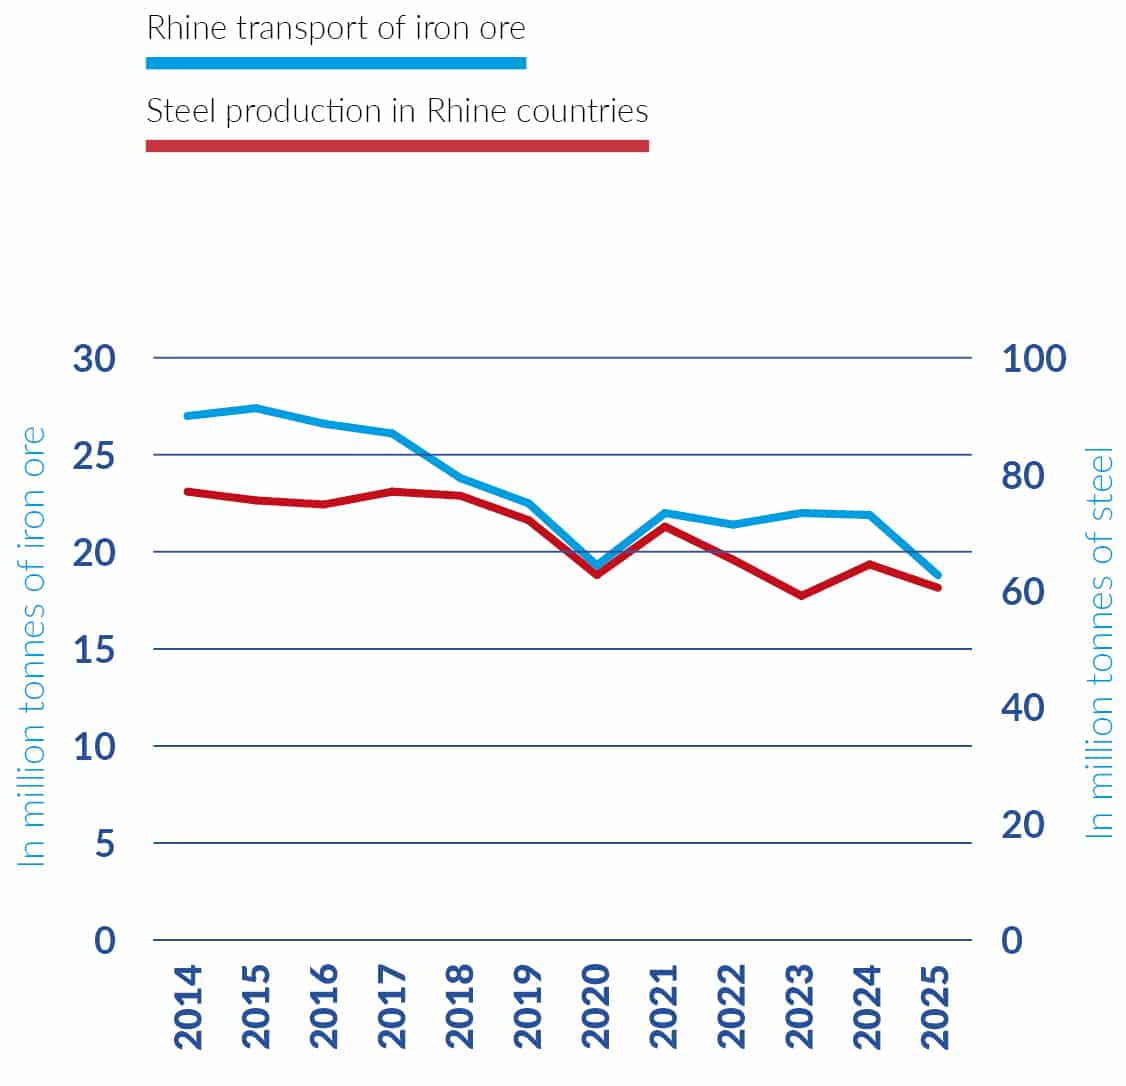
- Iron ore transport on the Rhine in general follows a similar trend to steel production, despite a small divergence in 2023, due to a replenishment of stocks in iron ore.
- In order to identify the influencing factors for iron ore transport on the Rhine, a statistical regression model was developed, based on monthly data for iron ore transport on the traditional Rhine from the year 2000 until the year 2025. The results show that around 75% of the data movements56 of iron ore transport are explained by only four influencing or explanatory factors, shown in the following infographics:
- Based on this table the following conclusions can be drawn. During the time period 2000 to 2025, an increase in steel production of +1% was followed by an increase in iron ore transport of +0.679% (on average).57 A negative coefficient is associated with water level, indicating that lower water levels lead to less iron ore transport. Moreover, this relationship is non-linear: the lower the water level, the stronger is the negative impact on iron ore transport if the level drops further.
- The financial crisis in 2008/2009 had a permanent effect on the level of iron ore transport. Volumes following this crisis were systematically lower than they were previously (by around 25%). This crisis acted as a strong catalyst, accelerating the structural decline of classic steel production in western Europe.58 In particular, the crisis was seen as an opportunity to shut down inefficient steel plants due to dwindling demand, which were not reopened when demand recovered. In all three countries relaying on Rhine and Moselle transport of iron ore (Germany, France and Luxembourg) steel production was significantly lower in 2025 compared to 2007.59
- The Covid pandemics and its effect on industrial production, as well as the output in the service sector, seems to have acted as another crisis catalyst, structurally lowering steel demand and iron ore transport on the Rhine.
- Finally, iron ore transport is very energy intensive (push boats and convoys), so that the fuel price for gasoil turned out to be of influence for the level of transport.
- According to this model, a short and mid-term forecast for iron ore transport must look at the forecast for German steel production, hydraulicity and fuel prices.
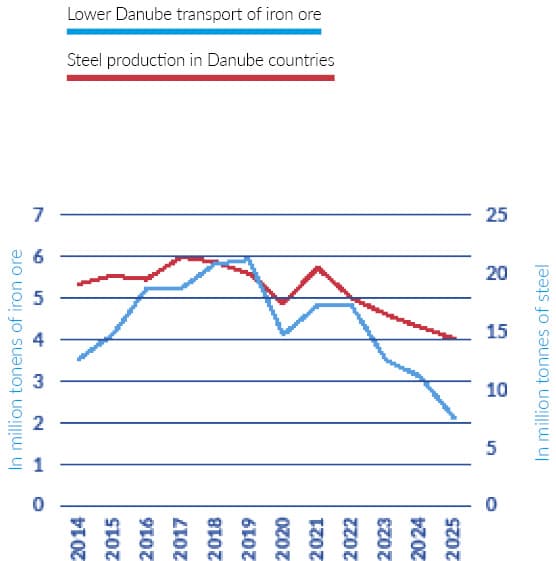
- Steel production in Danube countries60 amounted to 14.3 million tonnes in 2025, a decrease of -6.5% compared to 2024.
- Steel demand is dependent upon the development in the steel using sectors, which are, particularly, the construction sector and the automobile industry. In Germany, two-thirds of demand for steel comes from these two sectors, for which the following outlook can be expected according to Eurofer:61
– The construction sector is expected to continue growing in 2026 (+1.5%), and in 2027 (+2.9%), driven by recovery in housing demand and a pick-up in infrastructure spending.
– For the automotive industry, a moderate decline is expected in 2026 (-0.2%), before increasing in 2027 (+2.9%), although output volumes are expected to remain well below those recorded in 2019. - Based on the coefficients of the econometric model, the forecast of steel production in the construction and automotive sectors in 2026 (+2.4% / +0.9%) and 2027 (+2.8% / +1.7%), and assumptions for water levels, a scenario for iron ore transport in 2026 and 2027 was developed. This scenario assumes a growth of steel production as expected, and water levels at a historically average level.
- The scenario was developed by translating the expected increase in steel production into a forecast for iron ore transport (using the coefficient +0.679 of the model, see table 1). The resulting scenario points to a recovery of iron ore transport to a limited extent in 2026 and 2027.
- Mineral oil products are the largest product segment on the Rhine with an annual transport volume of 63 million tonnes (2025). They have a share of 19% of all goods on the traditional Rhine and a share of 23% on the entire Rhine.
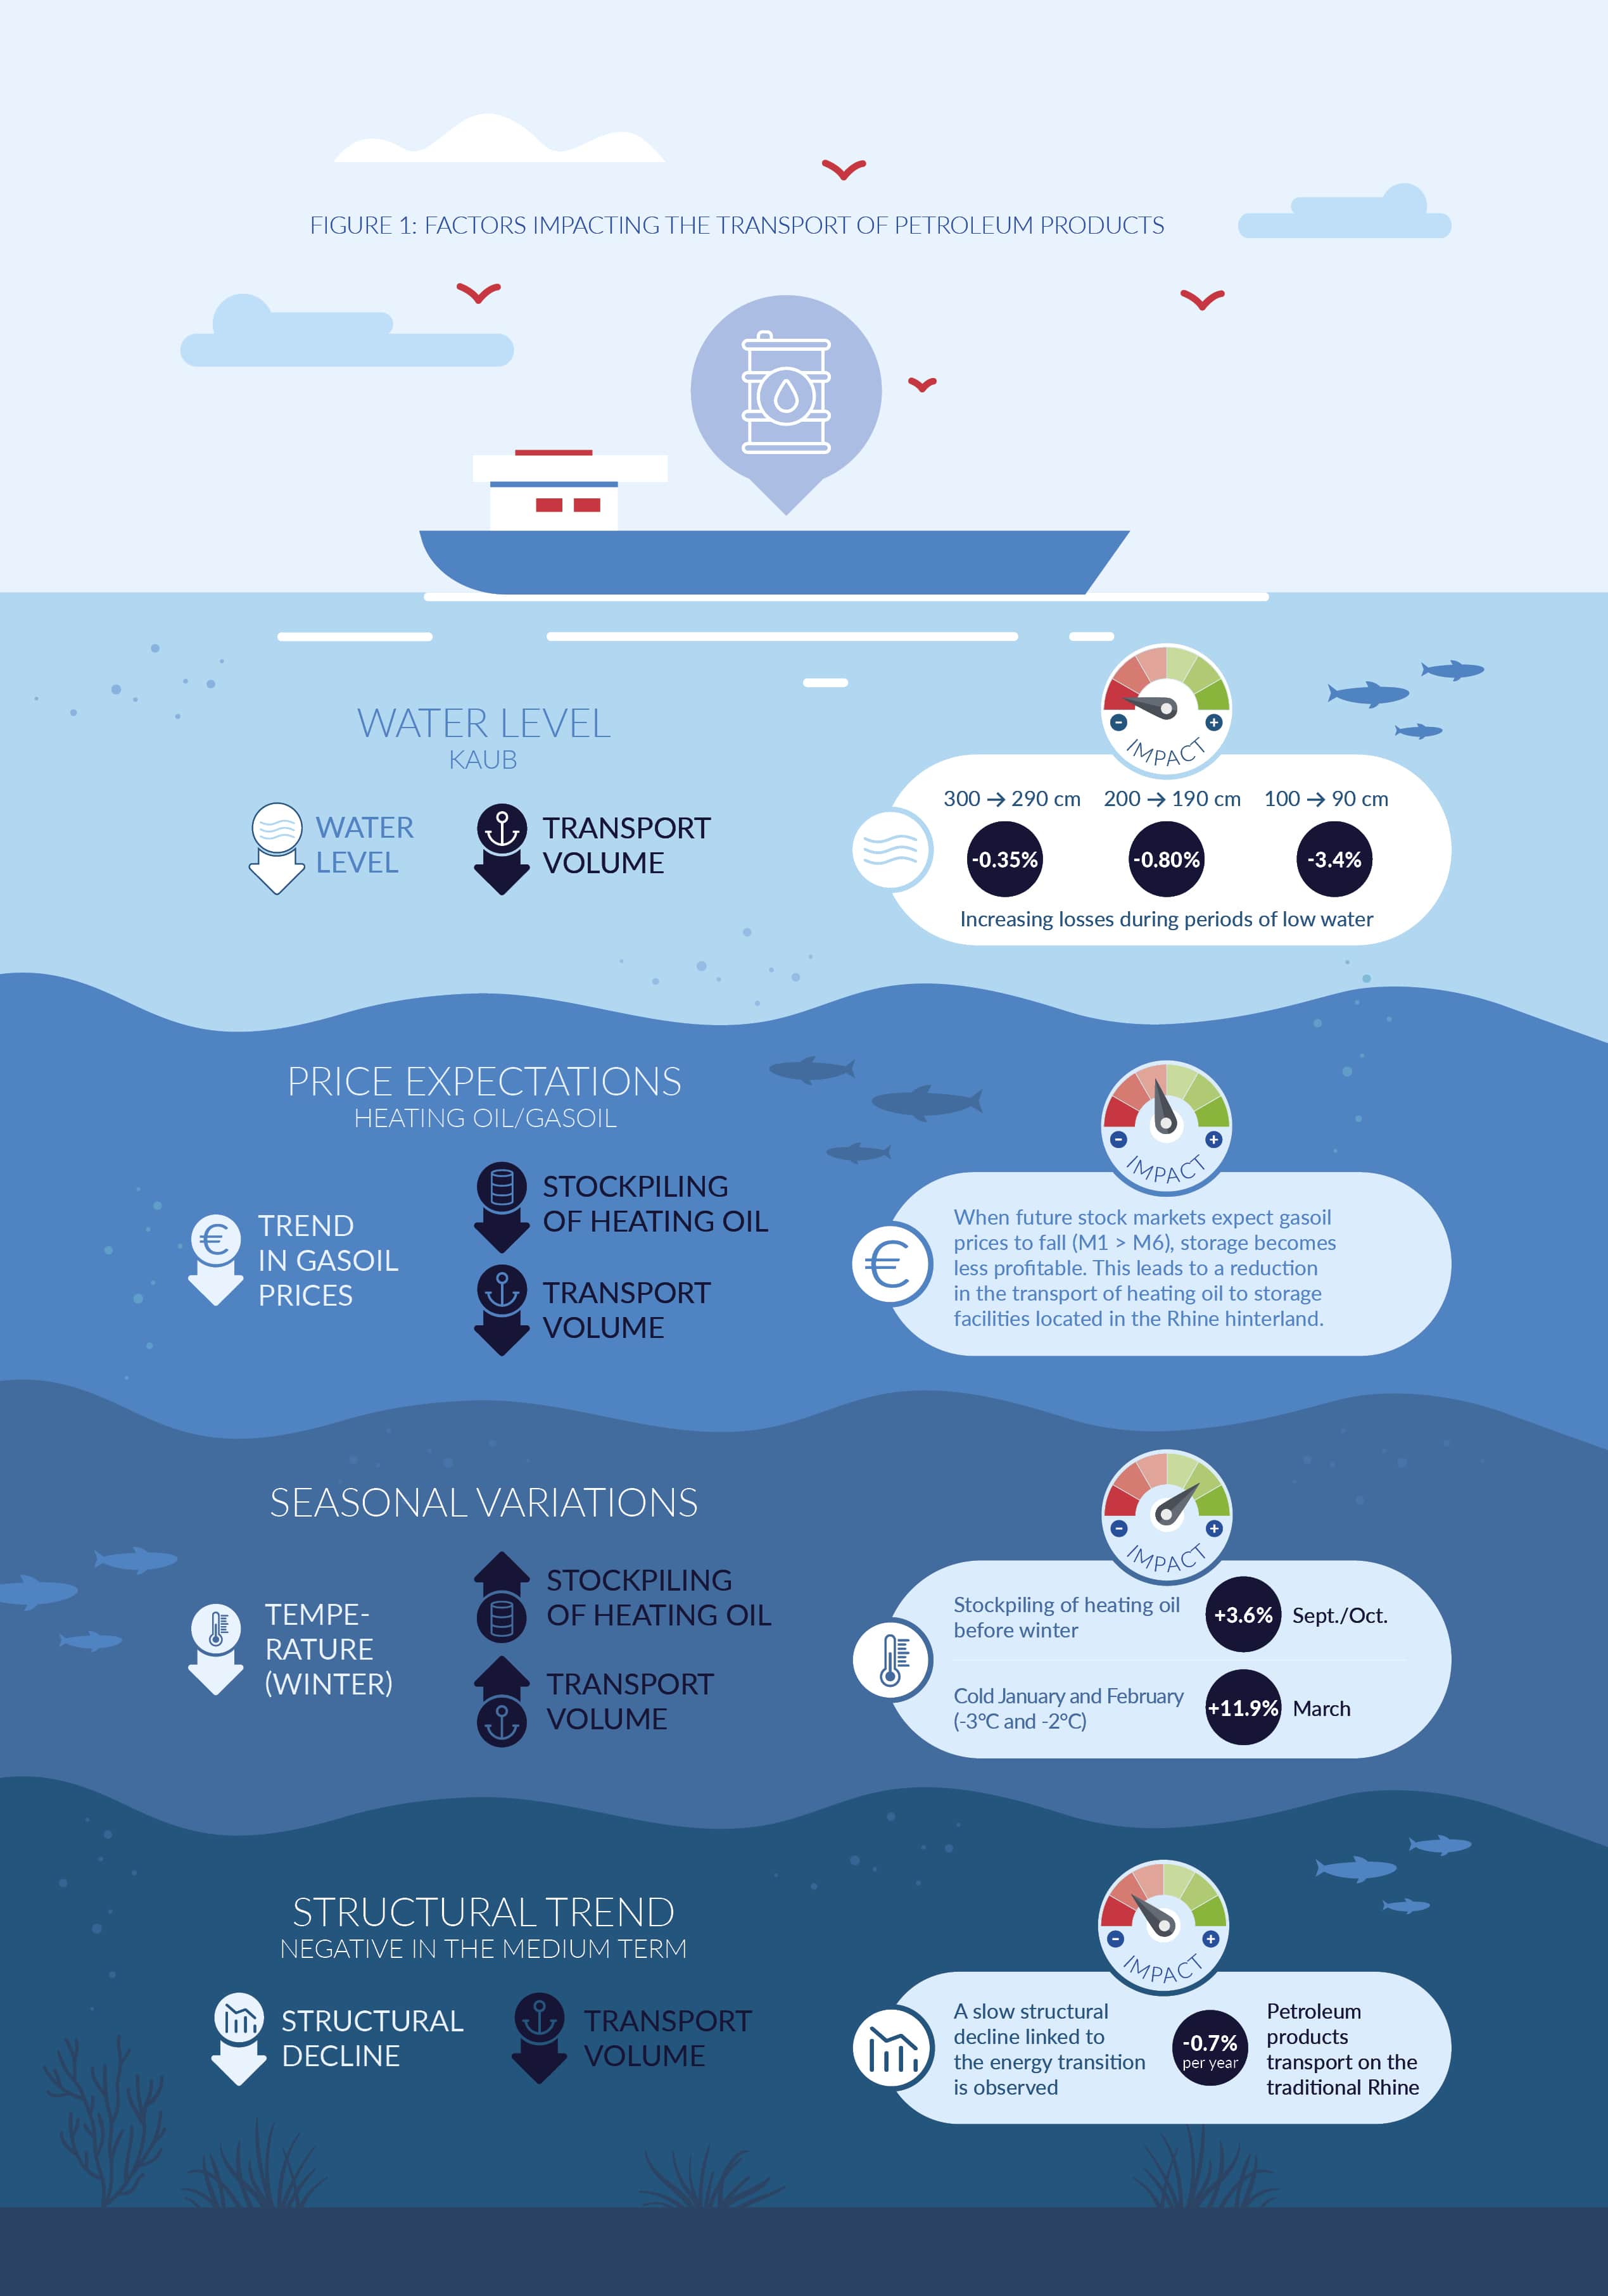
- In order to better understand the influencing factors for mineral oil transport on the Rhine, monthly data for mineral oil product transport on the traditional Rhine dependent variable) were analysed and modelled using a multiple non-linear regression model. The explanatory variables were selected on the basis of evidence from market observation and information from market reports of other relevant market research firms (Insights Global). The estimation results point to a dominant influence of the physical variable ‘water level’ which physically limits transport, particularly during low water. Economic factors include seasonal effects on heating oil supply in autumn and winter, as well as price expectations for gasoil, the core product within mineral oil products on the Rhine. These price expectations are measured via the difference between the 1-month future price for gasoil and the 6-month future price. They determine the economic incentives for stockpiling and transporting petroleum products. Lower gasoil prices in the future (backwardation) act as limiting factor for stockpiling and for transport, as is put forward in market comments. This was confirmed by the model.
- Furthermore, mineral oil transport on the traditional Rhine is also influenced by a slight negative trend, leading to a reduction in mineral oil transport of -0.7% per year, irrespective of physical and economic factors. This structural trend is attributable to savings in thermal energy resulting from efficiency improvements and the switch to more sustainable energy sources.
- Overall, the model suggests that the transport of mineral oil products on the Rhine is centred around two main explanatory blocks: 1) hydrology and 2) stockpiling due to seasonal and economic signals.
- Based on the econometric model, two scenarios for transport demand in 2026 and 2027 were developed. The two scenarios are identical in all respects except for one: the assumed Rhine water level. All other variables are either deterministic, such as the time trend (no estimation required) or held constant across scenarios. This is the case for the seasonal effect in autumn and the winter temperatures.
- Future water levels cannot be predicted with precision. Instead, monthly reference values were derived from the 22 years of historical observations (2003–2025). For each month, two percentile values were extracted:
– Optimistic scenario: the 75th percentile of historical water level values for each month. This corresponds to a year with above-average water levels: only 25% of historical years had water levels this high or better.
– Pessimistic scenario: the 25th percentile. This corresponds to a year with below-average water levels: 75% of historical years had better conditions than this. Rhine draft restrictions apply and barges must operate below full load, reducing effective transport capacity. - As to the gasoil future prices, the outlook for 2026 and 2027 is subject to considerable uncertainty, but energy market forecasts point towards a moderate decline in crude oil and gasoil prices compared to 2025.62 In this context, a sustained backwardation was assumed for the entire forecast. As the model results confirm, backwardation reduces the economic incentive for traders and distributors to build up stocks of gasoil. In turn, lower stockpiling activity reduces transport demand on the Rhine. The assumed spread was derived as the historical monthly average spread plus a backwardation premium of +2.0 in 2026 and +1.7 in 2027, with a floor of 1 to ensure the backwardation assumption is never violated. The slight reduction of the premium in 2027 reflects the principle that commodity markets do not sustain pronounced backwardation indefinitely.
- If oil and gasoil prices do gradually decline in 2026 as forecasted, this backwardation effect would continue to act as a limiting factor for mineral oil transport volumes on the Rhine, reinforcing the structural downward trend already identified in the model. It should be noted, however, that oil price forecasts carry significant uncertainty, and any unexpected supply disruptions or demand increases could change this outlook considerably.
- In the optimistic scenario, better waterway conditions lead to a slightly higher transport demand than in the low water scenario. For the traditional Rhine, the annual volume would amount to 27.5 million tonnes in 2026 in the optimistic scenario, compared to 25.6 million tonnes in the pessimistic scenario. For the year 2027, the optimistic scenario would include a volume of 27.3 million tonnes, and the pessimistic scenario 25.5 million tonnes.
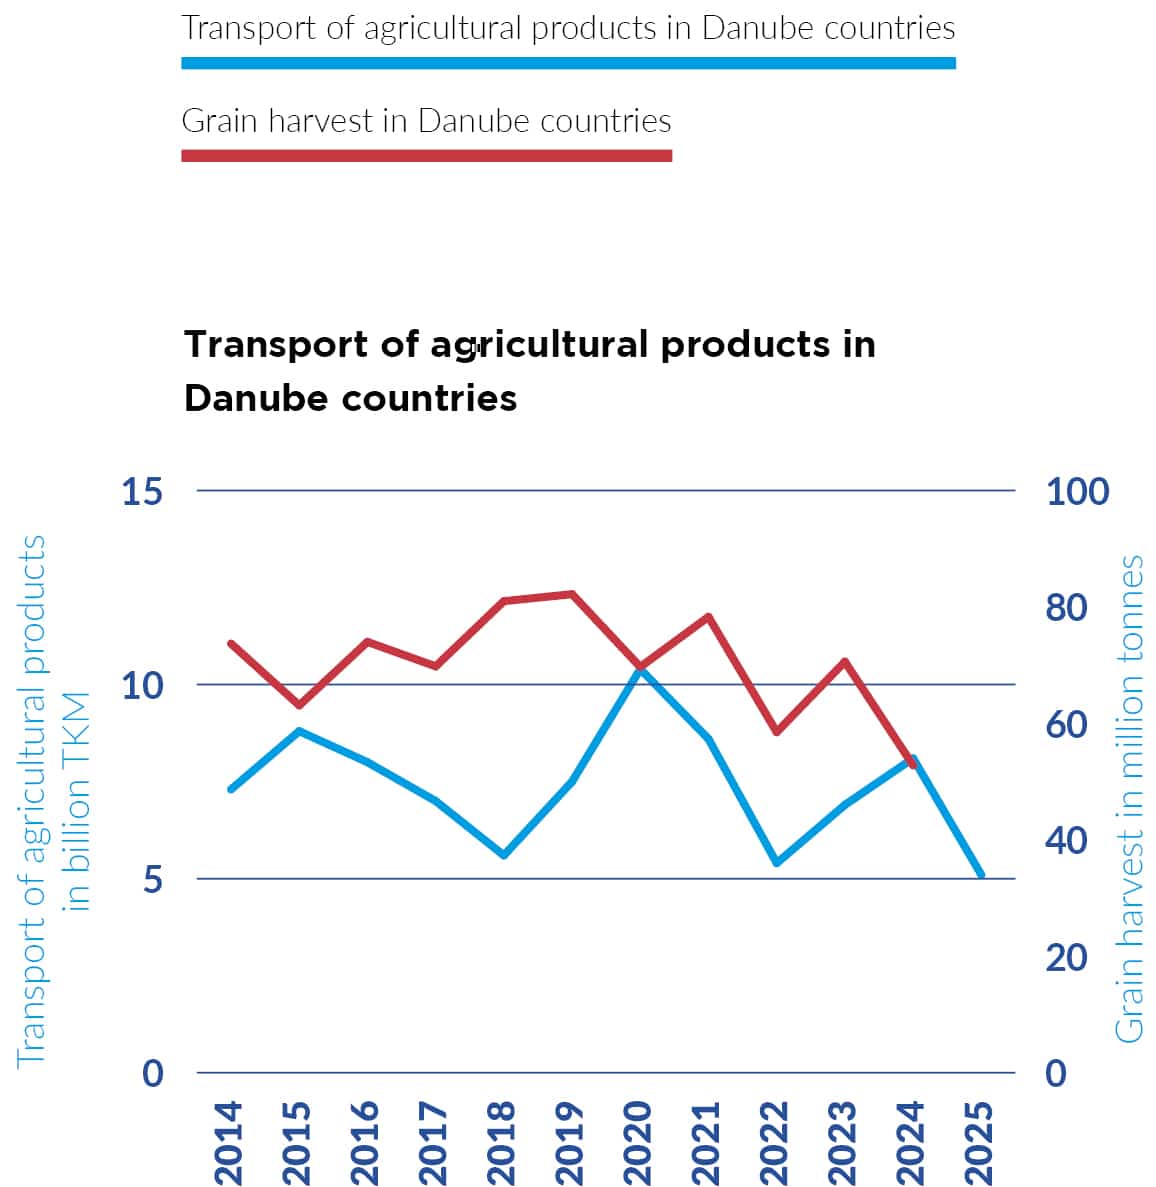
- Agricultural and food products have a share of around 10% in Rhine navigation and around 33% in Danube navigation.
- Wheat
For soft wheat,63 harvest volumes for the 2025/26 season in the EU, including in France, are well above the five-year average. On a worldwide scale, harvest volumes are also above the five-year average. The situation is similar for hard wheat,64 where harvest volumes are slightly above the five-year average in the EU and worldwide. EC projections for the 2026/2027 season remain on the lower side, indicating a 6% decrease compared with the previous season, while still broadly consistent with the five year average. - Barley
Worldwide production increased to 154.8 million tonnes and EU production to 55.7 million tonnes for the 2025/26 season. Harvest volumes on a worldwide scale, as well as in the EU-27, including in France, are above the five-year average. Harvest results are foreseen to decrease in the EU 2026/27 season, to a level of 54.7 million tonnes (-2%) while still remaining above the five-year average. - Maize
Harvest results on a worldwide scale increased to 1,301 million tonnes in the season 2025/26, above the five-year average. In the EU, production decreased to 58.1 million tonnes, below the five-year average, but is projected to increase to 61.2 million tonnes (+5%). - The year 2025 was marked by uncertainty and volatility, driven by a weakened economic growth, policy shifts, and geopolitical tensions in Europe and the Middle East. With this difficult global economic context, confidence in the EU-27 chemical industry weakened since businesses faced a high level of uncertainty, further deteriorating in the autumn and reaching around -19% in October 2025. At the same time, energy costs in Europe remained among the highest in the world, and weak demand has continued to weigh on chemicals sales. According to the German Chemical Industry Association (VCI), many industrial customers reduced production and remained cautious about ordering chemicals throughout 2025.65
- As a result, the output of the EU-27 chemical industry remains significantly below the pre-crisis levels of 2014 to 2019 but saw a modest increase of +1.6% in 2025 (following a contraction of -3% in 2024), underperforming the EU-27 manufacturing average. Likewise, many downstream industries that rely on chemicals reported a decline in output levels in 2025.66
- With regard to transport performance, the share of chemicals amounts approximately to 17% on the Rhine and 11% on the Danube. The transport performance for chemicals in Rhine and Danube countries has fluctuated over the last five years, with significant drops in 2018 (low water effect) and 2022 (as a consequence of the war in Ukraine and the low waters). For both rivers, the trend in transport demand roughly followed the trend in production.
- 2026 is expected to remain challenging for the chemical industry since the sector now faces soft demand, limited investment, and global uncertainty. The core challenge is that EU-27 capacity utilisation remains at historically low levels, falling well below both the EU’s long-term average and the US average. In early 2026, capacity utilisation in the EU-27 chemicals sector increased slightly, reaching 73.2% in the first quarter of 2026 and 74.3% in the second quarter of 2026, though it remains below the long-term average of 81.3%.67 VCI reported that capacity utilisation in the chemical industry fell to around 70-72% during 2025, the lowest level in decades and below the profitability threshold. 68
- European producers continue to face a major competitive disadvantage due to high energy costs. Throughout 2025, European gas prices were 2.5 times higher than in the United States, putting additional pressure on production costs. In early 2026 (January-April), European gas prices remained 3.3 times higher than US levels. Furthermore, the industry faces intense competition from China, particularly in commodity products and petrochemicals, where Chinese producers benefit from large-scale production capacity and lower production costs. Furthermore, China’s economic policy artificially boosts the country’s exports by devaluing its currency and providing subsidies to exporting companies.
- Container transport on the Rhine and in Rhine countries has been declining for several years. There are five main reasons for this:
1) Low water: severe low water periods in 2018 and 2022 leading to a modal shift away from IWT.
2) Geopolitical instability:
a. War in Ukraine: decrease (2022) and stagnation (2023-2025) in maritime container throughput in the seaport of Rotterdam due to the war in Ukraine;
b. Attacks by Houthi rebels on cargo ships in the Red Sea;
c. Conflict in the Middle East.
3) Pandemics: in the aftermath of the pandemic, the consumption of goods has slowed down, while the consumption of services has increased.
4) Logistical inefficiencies: within container barge handling in the seaports, maritime vessels are handled with priority which leads to long waiting times and less reliability of IWT.
5) Trade policy and tariffs: rising trade tensions, including US tariffs, have reduced trade efficiency and contributed to slower growth in global container volumes. - At the same time, there are concerns regarding the growing imbalance between imports and exports of containers. This is likely to result in increasing numbers of empty containers being repositioned to seaports in order to ensure their timely availability for loading elsewhere in the world. While these movements contribute to transport volumes, they do not necessarily improve the overall efficiency of the logistics system and may create additional operational challenges in the future.
- The reference series which gives an orientation about the outlook for container transport in IWT is the index of container throughput in the Northern Range.69
- Despite the decline in container throughput since 2022, Northern Range ports70 showed signs of recovery in 2024 which continued into 2025. However, a renewed downturn emerged in the first three months of 2026, largely due to the war in Iran. Overall, while the global index shows a steady upward trend, the Northern Range index exhibits weaker growth and greater volatility, diverging noticeably in recent years.
- The outlook for container transport in inland navigation remains mixed. While short-term growth is projected, container trade is expected to grow at a slower pace than before. The IMF’s World Economic Outlook of April 2026 projects global growth at only +3.1% in 2026 and +3.2% in 2027, lowered from earlier estimates due to the outbreak of war in the Middle East at the end of February 2026.
- In addition, world trade volume growth is now expected to decline from +5.1% in 2025 to just +2.8% in 2026, before rebounding to +3.8% in 2027. The closure of the Strait of Hormuz has disrupted energy supply chains and driven up oil and gas prices, worsening the pressure already caused by US tariffs and geopolitical fragmentation.71 The conflict in Iran is therefore expected to further weaken container activity in northern European ports in the short term, with knock-on effects for inland navigation.72 Looking ahead, the persistence of low growth will depend on the evolution of geopolitical tensions. In the medium term, additional risks include potential trade conflicts arising from EU efforts to reduce dependency on China.
- The outlook for the European river cruise fleet points to continued expansion in the coming years. Newbuilding activity is projected to remain dynamic, with 17 new river cruise vessels scheduled for delivery in 2026, followed by a significant increase to 25 vessels in 2027. These figures confirm a strong recovery and growing confidence in the sector as to future demand. This expansion will also translate into additional passenger capacity. Overall, the order books signal a sustained positive outlook for the European river cruise industry.
- As to the outlook, the majority of companies interviewed for a study of the European industry Association IG River Cruise, indicated that they expect the growth trend to continue regarding the number of passengers and the revenue in 2026, with a constant strong growth momentum without slowdown for distant markets.73
- In France, 88.2% of managers in the river tourism sector express confidence about the next five years and plan for investments in the short term. These investments are primarily aimed at modernising fleets, meeting environmental requirements, restructuring their human resources and digitising. Such investments are taking place despite persistent constraints such as rising operating costs, uncertainties surrounding technological developments and pressures in the labour market. 74
STEEL AND IRON ORE
FIGURES 1 AND 2: STEEL PRODUCTION IN RHINE COUNTRIES AND TRANSPORT OF IRON ORE ON THE ENTIRE RHINE (IN MILLION TONNES)
ch8_fig1_raw data
ch8_fig2_raw data
Sources: Eurofer, Destatis, Rijkswaterstaat, CCNR analysis
Switzerland: estimation
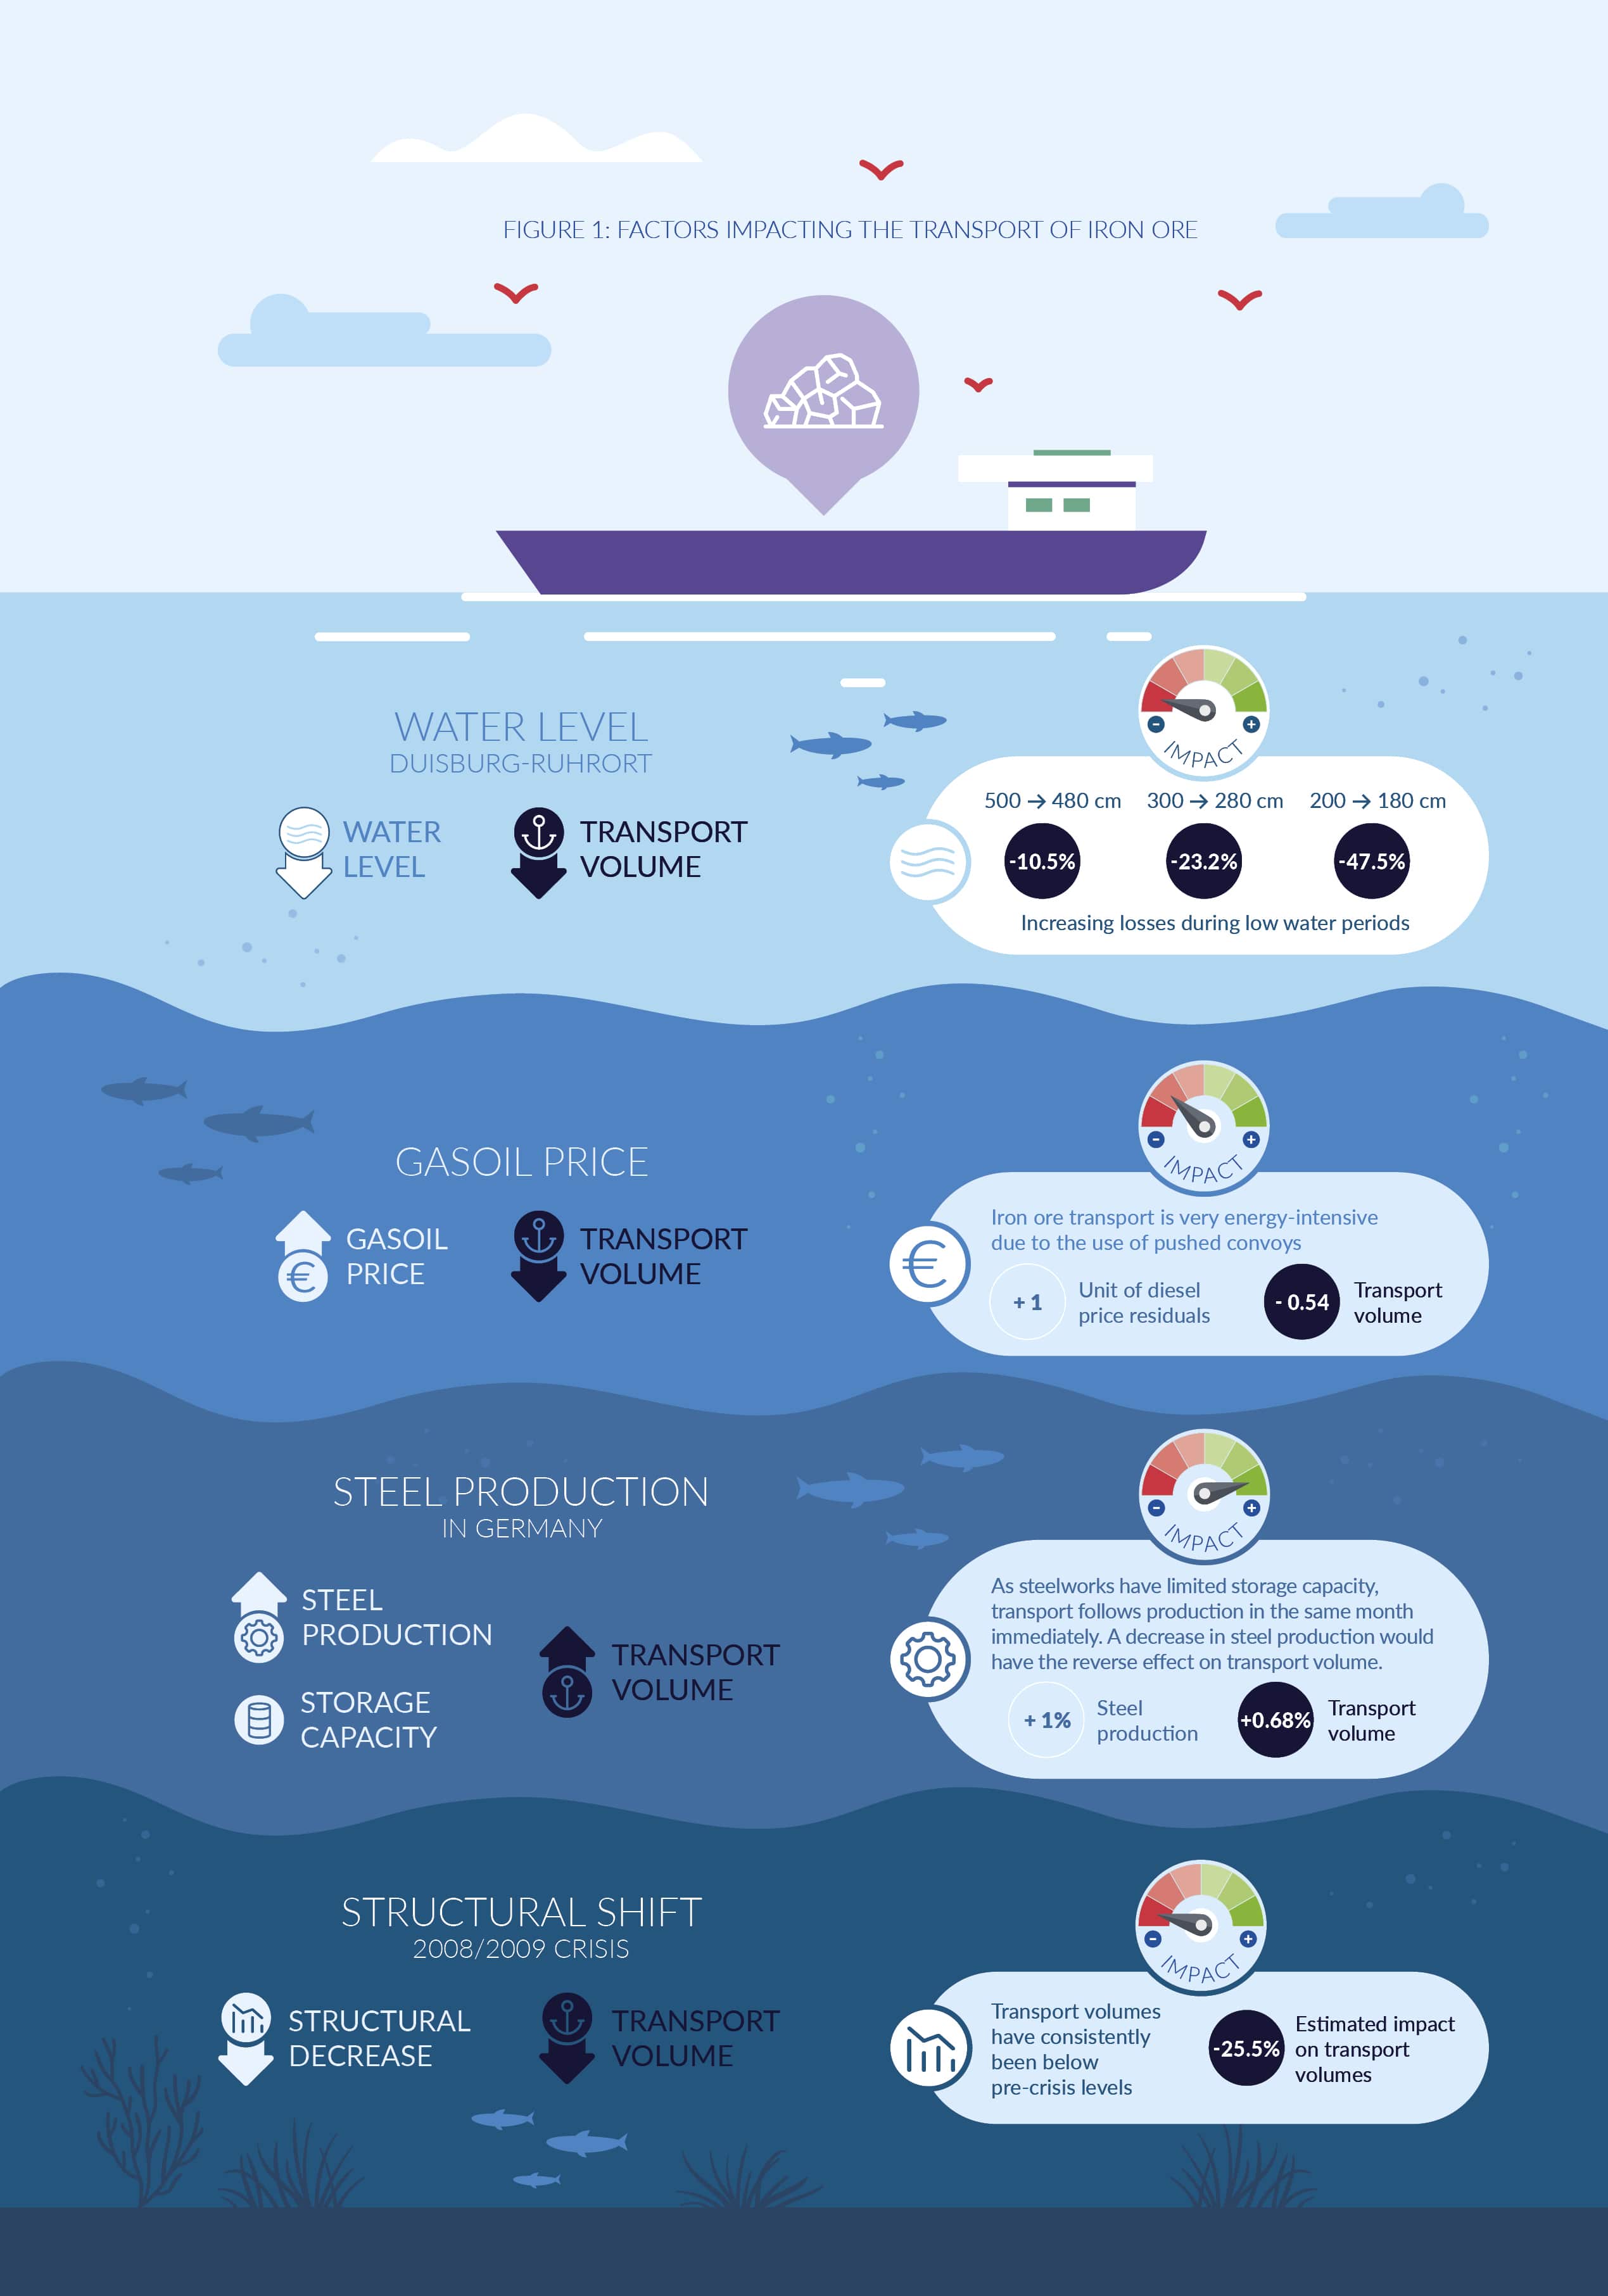
TABLE 1: EXPLANATORY VARIABLES FOR IRON ORE TRANSPORT ON THE RHINE – RESULTS OF A STATISTICAL MODEL (BASED ON DATA FOR THE PERIOD JANUARY 2000-DECEMBER 2025)
| Explanatory variable | Coefficient of influence | t-statistic * | Confidence level** |
|---|---|---|---|
| LN (German steel production) | +0.679 | +10.87 | 99% |
| Water level Duisburg-Ruhrort (reciprocal) | -19.607 | -2.06 | 95% |
| Financial crisis 2008/2009 | -0.189 | -7.17 | 99% |
| Fuel price (gasoil) | -0.536 | -5.5 | 99% |
| Constant | +2.334 | +4.45 | 99% |
Sources: CCNR calculation based on data from Destatis, data from WSV, provided by BfG.
* The t-statistics are calculated with the NEWEY-WEST procedure which makes them robust against autocorrelation and heteroscedasticity. The higher the t-statistic in terms of amount, the greater the statistical significance.
** This level is linked with the t-statistic and explains by which probability the result for an explanatory variable is reliable and not due to chance.
FIGURE 3: NATURAL LOGARITHM OF MONTHLY IRON ORE TRANSPORT ON THE TRADITIONAL RHINE AND PERMANENT EFFECT OF STRUCTURAL EVENTS
ch8_fig3_raw data
Source: Destatis
FIGURES 4 AND 5: STEEL PRODUCTION IN DANUBE COUNTRIES AND TRANSPORT OF IRON ORE ON THE LOWER DANUBE * (IN MILLION TONNES)
ch8_fig4_raw data
ch8_fig5_raw data
Sources: Eurofer, Eurostat [iww_go_atygo], National Institute of Statistics (Romania)
* Lower Danube = Romania
Data for Serbia and Bosnia-Herzegovina for 2024: estimation
Outlook for the iron ore and steel segment
FIGURE 6: SCENARIOS FOR IRON ORE TRANSPORT ON THE TRADITIONAL RHINE IN 2026 AND 2027 (IN MILLION TONNES)
ch8_fig6_raw data
Source: CCNR analysis
MINERAL OIL PRODUCTS
TABLE 2: EXPLANATORY VARIABLES FOR MINERAL OIL PRODUCT TRANSPORT ON THE RHINE – RESULTS OF A STATISTICAL MODEL (BASED ON DATA FOR THE PERIOD JANUARY 2003-DECEMBER 2025)
| Explanatory variable | Coefficient value | t-statistic* | Confidence** |
|---|---|---|---|
| Reciprocal of the Kaub water level | -30.50 | -9.97 | 99.9% |
| Seasonal effect in autumn (heating oil) | +0.035 | +2.29 | 95.0% |
| Seasonal effect in winter and March (heating oil) | +0.016 | +2.59 | 95.0% |
| Difference in gasoil futures prices*** | -0.003 | -1.8 | 90.0% |
| Structural trend | -0.0006 | -4.91 | 99.9% |
| Constant | +8.032 | +245.83 | 99.9% |
Sources: own calculation based on data from Destatis, data from WSV, provided by BfG, German Meteorological Service, Investing.com.
* The t-statistics are calculated with the NEWEY-WEST procedure, which makes them robust against autocorrelation and heteroscedasticity. The higher the t-statistic in terms of amount, the greater the statistical significance.
** This level is linked with the t-statistic and explains by which probability the result for an explanatory variable is reliable and not due to chance.
*** Percentage difference between the 1-month future price and the 6-month future price
Outlook for mineral oil products transport
FIGURE 7: SCENARIOS FOR TRANSPORT DEMAND FOR MINERAL OIL PRODUCTS ON THE TRADITIONAL RHINE IN 2026 AND 2027 (IN MILLION TONNES)
ch8_fig7_raw data
Source: CCNR analysis
AGRICULTURAL AND FOOD PRODUCTS
FIGURES 8 AND 9: GRAIN HARVEST PRODUCTION AND TRANSPORT OF AGRICULTURAL PRODUCTS IN RHINE COUNTRIES (IN MILLION TONNES)
ch8_fig8_raw data
ch8_fig9_raw data
Source: Eurostat [apro_cpsh1] and [iww_go_atygo]
Grain = cereals (excluding rice) for the production of grain (including seed).
FIGURES 10 AND 11: GRAIN HARVEST PRODUCTION AND TRANSPORT OF AGRICULTURAL PRODUCTS IN DANUBE COUNTRIES (IN MILLION TONNES)
ch8_fig10_raw data
ch8_fig11_raw data
Sources: Eurostat [apro_cpsh1] and [iww_go_atygo]
Grain = cereals (excluding rice) for the production of grain (including seed). For figure 10, missing data for Bosnia and Herzegovina in 2024. For figure 11, data for Serbia and Bosnia and Herzegovina are not available for the transport of agricultural products in Danube countries.
Outlook for the agri-food segment
TABLE 3: HARVEST VOLUMES FOR THE 2025/26 AND PROJECTIONS FOR 2026/2027 SEASON COMPARED TO FIVE-YEAR- AVERAGE
| Harvest season 2025/26 in million tonnes | World | EU-27 | France | Projection harvest season 2026/2027 EU 27 |
|---|---|---|---|---|
| Soft wheat | 844.2 | 142.3 | 33.3 | 133.6 |
| 5-year average | 787.0 | 130.5 | 31.8 | 134.4 |
| Hard wheat | 37.3 | 8.1 | 1.3 | 7.8 |
| 5-year average | 34.1 | 7.5 | 1.4 | 7.7 |
| Maize | 1,301.1 | 58.1 | 13.0 | 61.2 |
| 5-year average | 1,194.5 | 62.6 | 12.6 | 59.5 |
| Barley | 154.8 | 55.7 | 11.8 | 54.7 |
| 5-year average | 148.9 | 50.5 | 11.0 | 50.5 |
Sources: FranceAgriMer April 2026, Banque CIC agriculture, European Commission, Service de la statistique et de la prospective (SSP) du Ministère de l’Agriculture et de la Souveraineté alimentaire (France)
CHEMICALS
FIGURES 12, 13, 14 AND 15: INDEX OF CHEMICAL PRODUCTION AND TRANSPORT OF CHEMICAL PRODUCTS IN RHINE AND DANUBE COUNTRIES
ch8_fig12_raw data
ch8_fig13_raw data
ch8_fig14_raw data
ch8_fig15_raw data
Source: Eurostat [sts_inpr_a] and [iww_go_atygo], Manufacture of chemicals and chemical products.
Outlook for the chemical segment
CONTAINERS
FIGURES 16 AND 17: INDEX OF CONTAINER THROUGHPUT IN THE WORLD AND IN THE NORTHERN RANGE (2015 = 100) AND IWW CONTAINER TRANSPORT IN EUROPE (IN TEU)
ch8_fig16_raw data
ch8_fig17_raw data
Sources: RWI/ISL Container Throughput Index, seasonally adjusted series, Eurostat [iww_go_actygo]
Outlook for the container segment
OUTLOOK FOR PASSENGER TRANSPORT
-
Order books
Interviews among European companies
Interviews among French companies
LONG RUN OUTLOOK FOR IWT MARKETS IN RHINE AND DANUBE COUNTRIES BASED ON PRODUCTION
- Transport demand in IWT is derived from the development of underlying economic sectors and branches such as the construction and energy sectors, the steel industry, petrochemical and chemical industry, etc. To analyse the long-term development of transport demand according to goods segments, it is crucial to look at long-term trends of the production of the respective goods. The forecasts shown below were based on data from Oxford Economics from March 2026. These forecasts do not therefore consider events that took place after this date.
- It is acknowledged that besides production levels, several other factors should be considered to develop a comprehensive outlook model for IWT volumes. The level of production is however considered as one of the building blocks towards the development of such a model.
- It is therefore important to consider such long-term outlooks with caution given that these forecasts are mostly based on production, and that many exceptional years have distorted long-term trends in recent years (i.e. low water in 2018 and 2022, Covid in 2020, war in Ukraine from 2022 onwards, US “trade war” with Europe).
- For the Danube, the major goods segments with the highest shares are agricultural products, food products and iron ores. Due to a substantial amount of missing data, it is not possible to indicate the exact shares per goods segment for the Danube.
- IWT remains the preferred mode of transport for long-distance shipping of agricultural and food products. However, according to shipping companies questioned in a Haskoning study,75 the 2020 decade is likely to witness a decline in using the IWW mode of transport. Indeed, the period 2020-2030 is seen as a transition period for agriculture, with a trend towards smaller scale, more localised production. This tendency, coupled with a reduction in the number of small vessels (traditionally used for grain transport), could negatively weigh on IWW agricultural traffic volumes.
- Long-term forecasts for the production of agricultural products foresee an increasing trend in Rhine countries. The gross real output in this sector is foreseen to increase by +12.7% between 2025 and 2050 in the region. This output is primarily driven by France and Germany, which together account for the vast majority of the sector’s total production. Indeed, a correlation between harvest results and IWT of agricultural products has been found for France and Germany.
- Regarding Danube countries, the output of the sector is forecast to fall by -13.7% in the region between 2025 and 2050. Danube countries show a mixed pattern with Austria, Romania, Bulgaria and Croatia experiencing strong growth in the 2020s, but most countries in the region are facing a subdued development or slight declines in the following decades.
- The volume of coal transported on inland waterways is expected to decrease strongly in the next two decades, as European countries progress further in their energy transition. Germany, for example, has planned to close all of its coal power plants by 2038; as a result, the country’s coal imports have fallen significantly in recent years.77 This structural decline is reflected in long-term projections, which estimate a reduction of -85.4% in coal demand in Rhine countries and -73.5% in the Danube region by 2050, confirming a sustained downward trajectory for coal transport in European inland waterways.
- It is estimated that about 75-80% of traded goods are shipped by sea.78 Container transport, in turn, is the dominant mode of transport in maritime trade, particularly in value terms (around two- thirds of total maritime trade). The UNCTAD Review of Maritime Transport 2025 reinforces this dominance, noting that container shipping is increasingly utilised not only for traditional consumer goods but also for high-value cargo, processed minerals, and materials requiring enhanced security and traceability.
- In the absence of harmonised long term data on inland container flows by country, the sum of national imports and exports of goods was used as a proxy to analyse the evolution of container transport on the Rhine. This approach reflects the close structural link between inland container transport, seaborne container flows and overall economic openness, while recognising that these trends may not strictly evolve in parallel. Danube countries are excluded, as container transport on the Danube is exceedingly rare. Similarly, information related to world trade was used for the outlook for container transport in Europe.
- Based on long-term forecasts available for international trade, container transport on inland waterways is supported by a positive underlying trend in international trade. However, the physical limitations due to low waters and climate change will play another role, so that container transport in IWT might not follow the same steep and steady growth trend as shown in the outlook for international trade.
- The highest growth rate in international trade between 2025 and 2050 is expected to be seen in Switzerland (+56.7%). Germany should remain the country with the highest trade value, with an increase of almost +30.6% in the value of both its exports and imports. The growth of trade value in other western European countries is forecast to be +17.9% in Belgium, +36.8% in the Netherlands, and +24.5% in France. Rhine countries overall are expected to see moderate to strong growth (+32.2%) in the sum of real imports and exports of goods from 2025 to 2050.
- Inland waterway transportation is likely to remain in a strong modal split position for the transport of chemicals, as other modes of transport are generally not considered competitive alternatives, except for pipelines. The chemical industry supplies clients from many economic sectors, especially in agriculture (fertilisers), plastics, automotive, construction, paper and pulp industries.
- Real gross output of chemical production is expected to grow by +11% in France, by +50.2% in Switzerland, and by +20.8% in Belgium between 2025 and 2050. A rate of decrease of -12.4% is foreseen for Germany and of -3.5% for the Netherlands. The expected decrease in Germany and in the Netherlands is an alarming signal for the transport of chemicals on the Rhine, as these two countries’ chemical industries are important clients of IWT. The development of chemical transport on the Rhine will depend on the extent to which the chemical industry succeeds in decoupling its production from the burden of high energy prices, and the extent to which it will be able to make its production techniques greener. Furthermore, the European chemical industry might need active support by European economic policy, in order to counterbalance the active economic stimulation policy carried out by China.
- The worldwide trend towards reindustrialisation and the strengthening of the EU’s economic resilience is now set to be encouraged by the EC’s Clean Industrial Deal and the newly proposed Industrial Accelerator Act.79 This updated legislative framework aims to reverse recent industrial decline, setting a target for manufacturing to represent at least 20% of the Union’s gross domestic product by 2035.
- In Danube countries, chemical production is forecast to grow over all decades, with a growth rate of +31.3% from 2025 to 2050, especially in Hungary, Croatia, and Bulgaria, with only Romania experiencing a small decline during the period 2020-2030.
- According to a study conducted by Royal HaskoningDHV,80 the Dutch shippers believe that inland waterway transport will remain the main mode of transport for construction materials such as gravel, sands, stones and others. No major modal shift is expected, but as larger companies are being created by mergers and acquisitions, the number of smaller concrete mortar plants and smaller sand and gravel companies along small waterways is expected to diminish. Larger entities are concentrated along the waterways and look for more economies of scale. The upcoming years anticipate a surge in sand and gravel availability due to dredging efforts to expand waterways, coinciding with a growing demand for materials for dyke reinforcement in the face of climate risks.
- The transport demand depends strongly on the activity of the construction sector. According to the outlook of Oxford Economics, the inflation-adjusted real output in Germany will grow by +39.4% between 2025 and 2050. For France, the expected growth rate of real output in the construction sector is +6.6%, +40.6% in the Netherlands, +23.1% in Belgium and +20.8% in Switzerland. The construction sector in Rhine countries is expected to recover after a challenging 2020s for Germany, with a steady growth of +23.9% projected across countries between 2025 and 2050.
- However, a challenge lies in the declining number of small vessels in the Rhine region. This could negatively affect the inland waterway transport sector’s ability to benefit from growth in the construction sector.
- As countries progress through their energy transition, the demand for petroleum or mineral oil products is expected to continue its current modest downward trend, leading to a decline in its transport through inland waterways. The overall intensity of fossil fuel use has already been declining steadily since the mid-1970s.81 Even though there are financial and technical barriers to the development of carbon neutral propulsion technologies, it is assumed that mineral oil products will gradually be phased out from the propulsion mix in the next two decades. This shift is currently being accelerated not only by the impulse of the EU legislation ETS2 (Emissions Trading Scheme, the EU trading system for CO2 emissions) which is expected to drive the prices of fossil fuel upwards, but also by geopolitical shocks.
- Concerning coking coal, a transition towards carbon free steel production is likely, which is also expected to lead to a decrease in the demand for coking coal in the future. While in the very short term, some economies might temporarily switch to energy sources such as coal to soften the immediate shock of oil and gas disruptions, this is not considered a permanent solution as it undermines longer-term decarbonisation targets.
- For Germany, the outlook shows a decrease in the production of both products together of -29.7% until 2050. For France, a decrease of -53.7% is foreseen, a decline of -32% for the Netherlands and a decline of -23.4% for Belgium. Switzerland has a very low production level of petroleum products, which is the reason for rather high imports via the Rhine. The production of petroleum products and coke in Rhine countries shows a general decline of -33.3% after initial growth in some countries in the 2020s, reflecting the ongoing energy transition away from fossil fuels.
- In cases where steel production is located along inland waterways, a high waterborne method of transport for iron ore, coking coal and steel products is observed. Germany is the largest steel producing country in Europe and the Rhine is an important transport route for iron ore and steel products.
- As a circular economy is expected to play a more important role in the future (study conducted by Royal HaskoningDHV), Dutch shipping companies have communicated strong opinions on higher metals recycling rates and a subsequent decline in steel demand and production across western Europe. This could cause a decline in the transportation of steel, but also iron ore, as it will likely be replaced by recycled steel and less emission intensive production technologies. However, this transition is not expected to result in a clear overall decline in steel demand in Europe, but rather a shift in production processes. The demand for high quality steel is expected to remain high not only in developed countries, but is thought to increase in developing countries, which could make steel remain an important product in the European industry.
- However, between 2025 and 2050, the outlook for German steel gross output points to a decline of -18.3%. For France, a decrease of -65.8% is foreseen but based on a much lower absolute level of steel gross output. For the transport of iron ore and steel on inland waterways, the Belgian, French and German steel production is of high relevance as the steel industry in these countries is often located along inland waterways. This is not the case for Dutch and Swiss steel industry. Dutch steel production is located at the crossing of deep sea and inland waterways. Raw materials enter by sea, while products leave by inland waterways. The gross real output in this sector is foreseen to decrease by -28.7% between 2025 and 2050 in the Rhine region.
- Austria is expected to remain an important player in the steel sector along the Danube, even though it experiences a predicted decline of -2.1% between 2025 and 2050. Romania’s steel production is projected to experience a decline of -13.8% by 2050. The forecasts from Oxford Economics point to positive growth rates across other regions of central and eastern Europe, +10.9% for Hungary, and +9.5% for Slovakia.
TABLE 4: SHARE OF MAJOR GOODS SEGMENTS WITHIN RHINE TRANSPORT (BASED ON CALCULATION OF SHARE IN TONNES)
| Product segment | Share in % in 2023 | Share in % in 2024 | Share in % in 2025 | Average share 2015-2025 in % |
|---|---|---|---|---|
| Mineral oil products | 22.1 | 22.7 | 22.3 | 21.0 |
| Chemicals | 16.2 | 16.9 | 16.7 | 15.5 |
| Sand, stones, gravel | 17.3 | 16.6 | 16.6 | 17.2 |
| Container | 10.2 | 10.2 | 10.2 | 10.9 |
| Agribulk and food products | 9.6 | 10.0 | 10.2 | 9.5 |
| Iron ore | 7.9 | 7.7 | 6.7 | 7.5 |
| Coal | 7.3 | 6.2 | 6.7 | 8.3 |
| Metals | 5.0 | 5.1 | 5.2 | 4.8 |
Sources: CCNR calculation based on Destatis, Rijkswaterstaat and VNF
AGRICULTURE, FORESTRY, FISHERIES AND FOOD PRODUCTS
FIGURE 18: REAL GROSS OUTPUT OF AGRICULTURAL, FORESTRY AND FISHERY PRODUCTION IN RHINE AND DANUBE COUNTRIES * (2015 PRICES IN EURO)
ch8_fig18_raw data
Source: Oxford Economics
* Data were transformed from US-Dollar into Euro based on the US-Dollar/Euro exchange rate for the year 2015.76
TABLE 5: GROWTH RATES OF AGRICULTURAL, FORESTRY AND FISHERY PRODUCTION IN RHINE AND DANUBE COUNTRIES
| Countries | Growth rate 2025-2050 | Growth rate 2020-2030 | Growth rate 2030-2040 | Growth rate 2040-2050 |
|---|---|---|---|---|
| Rhine | +12.7% | -0.5% | +5.6% | +2.6% |
| Danube | -13.7% | -2.4% | -4.3% | -2.7% |
Source: CCNR calculation
COAL
FIGURE 19: COAL, DOMESTIC DEMAND IN RHINE AND DANUBE COUNTRIES, ANNUALISED (IN MILLION TONNES)
ch8_fig19_raw data
Source: Oxford Economics
TABLE 6: GROWTH RATES OF COAL DEMAND IN RHINE AND DANUBE COUNTRIES
| Countries | Growth rate 2025-2050 | Growth rate 2020-2030 | Growth rate 2030-2040 | Growth rate 2040-2050 |
|---|---|---|---|---|
| Rhine | -85.4% | -59.5% | -55.5% | -38.2% |
| Danube | -73.5% | -52.4% | -47.8% | -25.0% |
Source: CCNR calculation
CONTAINERS
FIGURE 20: YEARLY SUM OF REAL IMPORTS AND EXPORTS OF GOODS IN RHINE COUNTRIES * (2015 PRICES IN EURO)
ch8_fig20_raw data
Source: Oxford Economics
* Switzerland’s exports and imports value was converted from 2015 Swiss francs into 2015 euros.
TABLE 7: GROWTH RATES OF THE SUM OF REAL IMPORTS AND EXPORTS OF GOODS IN RHINE COUNTRIES
| Countries | Growth rate 2025-2050 | Growth rate 2020-2030 | Growth rate 2030-2040 | Growth rate 2040-2050 |
|---|---|---|---|---|
| Rhine | +32.2% | +18.3% | +11.8% | +11.0% |
Source: CCNR calculation
CHEMICALS
FIGURE 21: REAL GROSS OUTPUT OF CHEMICALS IN RHINE AND DANUBE COUNTRIES * (2015 PRICES IN EURO)
ch8_fig21_raw data
Source: Oxford Economics
* Data were transformed from US-dollar into euro based on the US-dollar/euro exchange rate for the year 2015.
TABLE 8: GROWTH RATES OF CHEMICAL PRODUCTION IN RHINE AND DANUBE COUNTRIES
| Countries | Growth rate 2025-2050 | Growth rate 2020-2030 | Growth rate 2030-2040 | Growth rate 2040-2050 |
|---|---|---|---|---|
| Rhine | +0.9% | +15.2% | +0.3% | +4.9% |
| Danube | +31.3% | +25.2% | +11.0% | +11.6% |
Source: CCNR calculation
CONSTRUCTION MATERIAL, SAND, STONES, GRAVEL
FIGURE 22: REAL GROSS OUTPUT IN THE CONSTRUCTION SECTOR IN RHINE AND DANUBE COUNTRIES * (2015 PRICES IN EURO)
ch8_fig22_raw data
Source: Oxford Economics
* Data were transformed from US-dollar into euro based on the US-dollar/euro exchange rate for the year 2015.
TABLE 9: GROWTH RATES IN THE CONSTRUCTION SECTOR IN RHINE AND DANUBE COUNTRIES
| Countries | Growth rate 2025-2050 | Growth rate 2020-2030 | Growth rate 2030-2040 | Growth rate 2040-2050 |
|---|---|---|---|---|
| Rhine | +23.9% | +3.7% | +6.9% | +5.7% |
| Danube | +36.3% | +7.8% | +13.5% | +7.6% |
Source: CCNR calculation
PETROLEUM PRODUCTS AND COKING COAL
FIGURE 23: REAL GROSS OUTPUT OF COKE AND REFINED PETROLEUM PRODUCTS IN RHINE COUNTRIES * (2015 PRICES IN EURO)
ch8_fig23_raw data
Source: Oxford Economics
* Data were transformed from US-dollar into euro based on the US-dollar/euro exchange rate for the year 2015.
TABLE 10: GROWTH RATES OF COKE AND REFINED PETROLEUM PRODUCTION IN RHINE COUNTRIES
| Countries | Growth rate 2025-2050 | Growth rate 2020-2030 | Growth rate 2030-2040 | Growth rate 2040-2050 |
|---|---|---|---|---|
| Rhine | -33.3% | -46.5% | -15.6% | -20.5% |
Source: CCNR calculation
STEEL AND IRON ORE
FIGURE 24: REAL GROSS OUTPUT OF IRON AND STEEL IN RHINE AND DANUBE COUNTRIES * (2015 PRICES IN EURO)
ch8_fig24_raw data
Source: Oxford Economics
* Data were transformed from US-dollar into euro based on the US-dollar/euro exchange rate for the year 2015.
TABLE 11: GROWTH RATES OF IRON AND STEEL PRODUCTION IN RHINE AND DANUBE COUNTRIES
| Countries | Growth rate 2025-2050 | Growth rate 2020-2030 | Growth rate 2030-2040 | Growth rate 2040-2050 |
|---|---|---|---|---|
| Rhine | -28.7% | +35.3% | -21.5% | -10.8% |
| Danube | +0.0% | +4.0% | -2.1% | +0.0% |
Source: CCNR calculation