


• Inland waterway freight transport performance in Europe (EU-27 plus Switzerland, Serbia, Ukraine and the Republic of Moldova) reached 122.7 billion TKM in 2025, representing a decrease of -3.3% compared to 2024. Rhine countries accounted for 80.0% of total transport performance, while Danube countries represented 19.8% (including Ukraine).
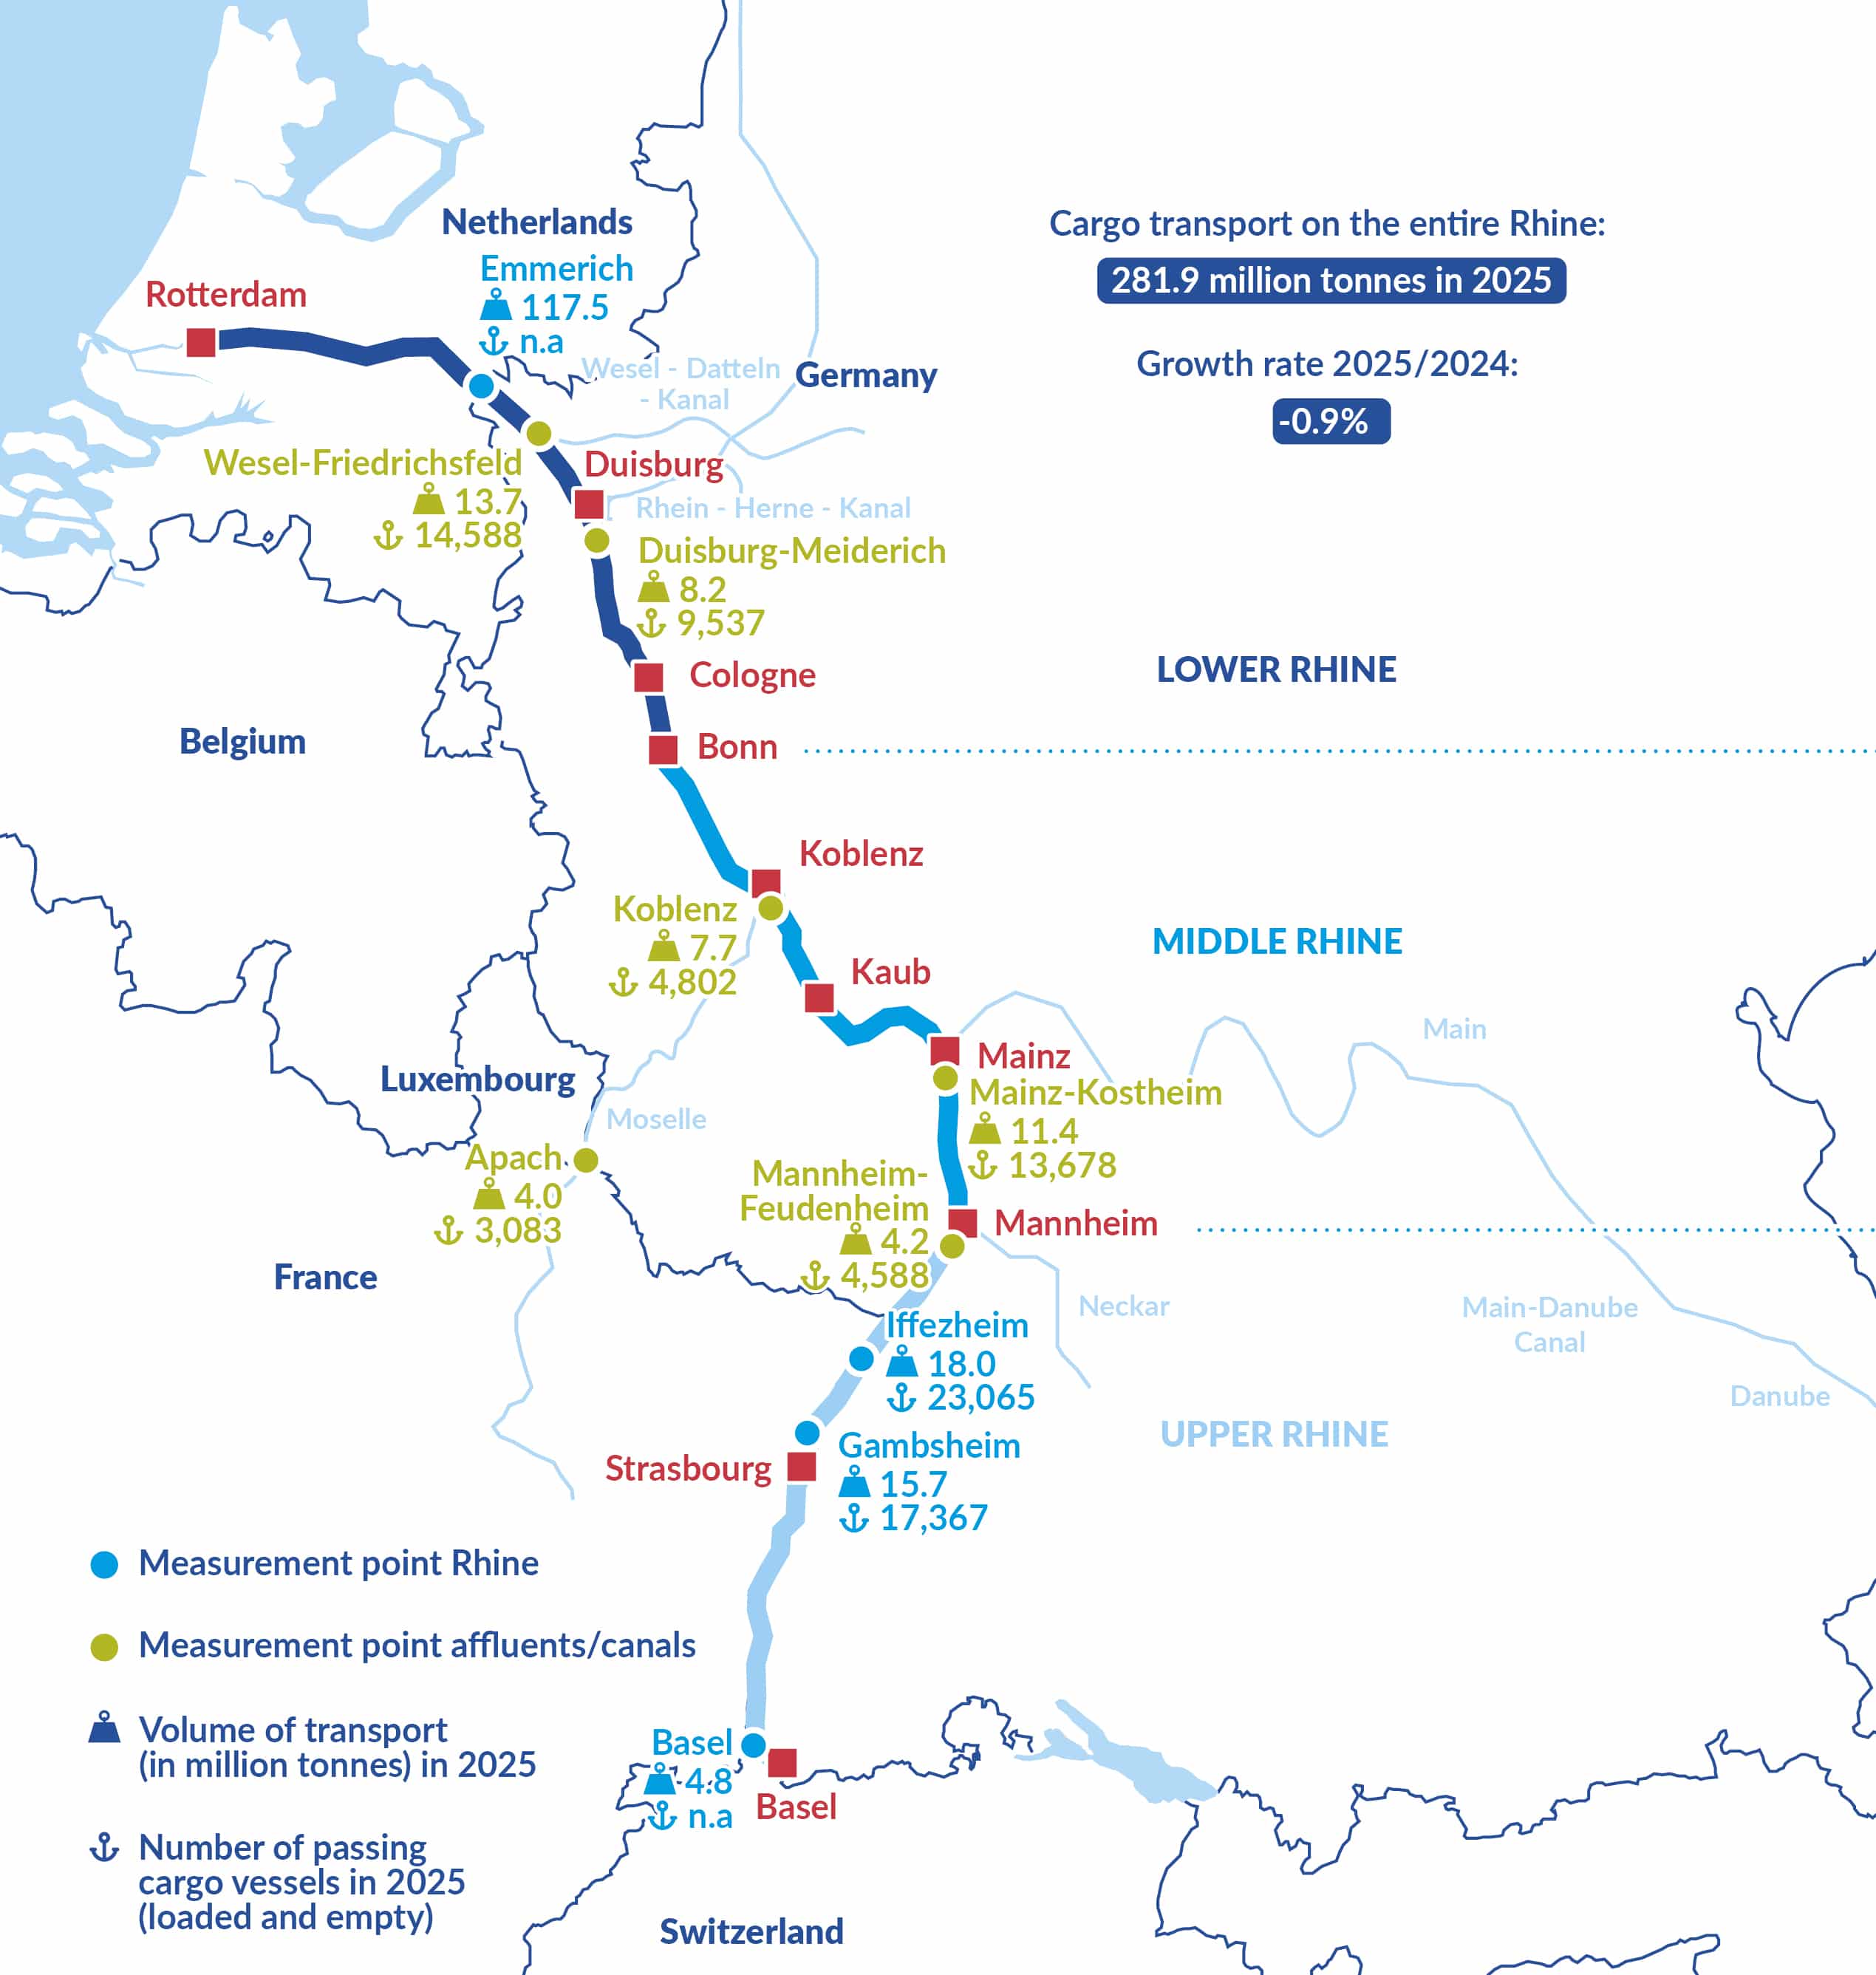
• Cargo transport on the entire Rhine amounted to 281.9 million tonnes in 2025, a decrease of -0.9% compared to 2024. Most cargo segments recorded lower volumes, while coal (+8.1%), metals (+1.6%), and agricultural products (+1.4%) registered increases.
• On the Danube, freight volumes declined in 2025 due to weak economic conditions, less favourable water levels and the continued impact of the war in Ukraine. Significant decreases were observed for agricultural products, food products and iron ore transport.
TRANSPORT IN EUROPE AND BY COUNTRY
- In 2025, in terms of inland navigation for Europe (EU-27 plus Switzerland, Serbia, Ukraine and the Republic of Moldova), freight transport performance decreased by -3.3% compared to 2024, reaching 122.7 billion TKM. Rhine countries (Belgium, France, Germany, Luxembourg, the Netherlands, Switzerland) accounted for 80.0% of total inland waterway transport performance in the EU-27, plus Switzerland, Serbia, Ukraine and the Republic of Moldova. The share for Danube countries was 19.8%.
- In 2025, 458.4 million tonnes of goods were transported on EU-27 waterways (-3.2% compared to 2024). From the total inland waterway transport performance in the EU-27 in 2025, which amounted to 117.97 billion TKM, a decrease of -3.0% compared to 2024 (EU-27 only), 75.1% represented transport that crossed a border in one way or another – whether it be in the form of export, import or transit traffic. Transit traffic taken separately had a share of 20.4% and export and import traffic had a share of 28.7% and 26.0%, respectively.
- In previous annual reports, this chapter focused solely on volumes transported along the traditional Rhine, namely the Rhine from Basel to the German-Dutch border. From 2024 onwards, reporting includes transport volumes on the entire Rhine from Basel to the North Sea (including the link to Antwerp via the Rhine-Scheldt link). In addition, in 2024, more refined data provided by VNF on the parts of the upper Rhine regarding traffic between French Rhine ports, and between Swiss and French Rhine ports, were incorporated for the years 2014 onwards.2
- Cargo transport on the entire Rhine (from Basel to the North Sea) amounted to 281.9 million tonnes in 2025, compared to 284.6 million tonnes in 2024. The result in 2025 was -0.9% lower than in 2024.
– The traditional Rhine (from Basel to the German-Dutch border) amounted to 147.3 million tonnes in 2025, compared to 150.2 million tonnes in 2024 and 146.8 million tonnes in 2023; the result in 2025 was -1.9% below the result of 2024.
– The lower Rhine in the Netherlands (from the German-Dutch border to the North Sea, including the link to Antwerp via the Rhine-Scheldt link3) amounted to 230.8 million tonnes, compared to 234.0 million tonnes in 2024.The result in 2025 was -1.4% below the result of 2024. - When calculating the total volume of goods transported on the entire Rhine, all steps were taken to avoid the double counting of volumes transported on both stretches. This is why the volumes on these two stretches cannot simply be added together, as certain volumes are transported on both stretches.
- The declining trend that is observed for the traditional Rhine can be attributed to a combination of factors: 1) the decrease in German industry production since 2018; 2) recurring low water periods (especially in 2015, 2018, 2022); 3) a certain deindustrialisation following the financial crisis of 2008/2009.
- In terms of geographical structure, transport demand is higher on the lower Rhine compared to the middle and upper Rhine, as illustrated in figure 6. This higher transport demand on the lower Rhine can be explained for several reasons:
– Dense delta network in the Netherlands and inter-port traffic (Rotterdam, Antwerp, Amsterdam, North Sea Port) connecting important petroleum and chemical industrial hubs as well as a high number of container terminals.
– Important steel and petroleum industrial hub in the lower Rhine region in Germany.
– High fairway depths on the lower Rhine. - In terms of global cargo transport volumes for the entire Rhine, the segments of mineral oil products, chemicals and sand, stones, gravel, are the top three contributors.
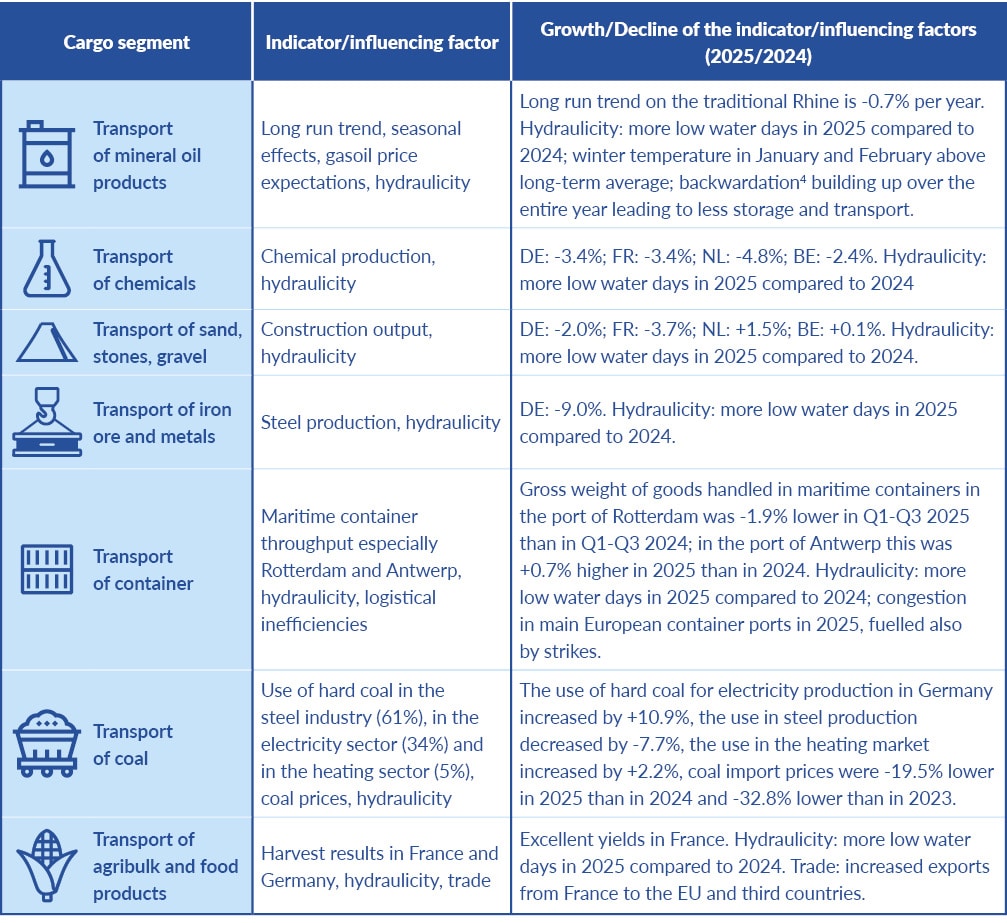
- The following table gives an overview on key indicators/influencing factors that are important for the explanation of the evolution of cargo transport on the Rhine for the particular goods’ segments.
- The mineral oil segment is driven by a combination of factors (see also chapter 8, short-term outlook). Next to hydraulicity, the transport is influenced by a negative long run trend which is present on the traditional Rhine. Other important influencing factors are seasonal effects regarding heating oil demand (in autumn and winter) and price expectations for gasoil that affect the incentive for storage of mineral oil products (triggering an increase or a decrease of storage in the Rhine hinterland and related transport demand).
- In 2025, all of these factors pointed to a decrease in mineral oil transport:
– More low water days (in particular in spring 2025) led to physical limitation of transport.
– Winter temperatures were above the average (compared to reference period 2003-2025) resulting in less heating oil demand in winter.
– Actual gasoil prices were higher than future prices (London Gas Oil futures market), showing a positive spread (‘backwardation’) for the entire year which reduced incentives for storing heating oil in the hinterland. - Compared to the traditional Rhine, the transport on the Dutch Rhine in the ARA region5 is also driven by additional influencing factors: 1) bunkering of seagoing vessels by inland vessels, 2) blending of fuel for exports towards overseas destinations via ARA seaports.6 These activities modify the negative trend on the traditional Rhine positively.
- Two other goods segments in Rhine transport are influenced by long run trends or factors: iron ore (see chapter 8, short-run outlook) and container.
– Iron ore transport was negatively affected by the financial crisis 2008/2009, and volumes are systematically lower (-25%) since this crisis. The crisis seems to have acted as a catalyst for deindustrialisation.
– Decreasing trend observed in recent years for container transport driven by several influencing factors. - The reasons for the strong increase in coal transport in 2025 are a drop in the electricity generation by wind onshore: -5%, biomass: -4%, hydraulic power: -24% in Germany in 2025, combined with low coal prices.7 The strong drop in hydraulic electricity generation was due to climatic factors (draughts). Hard coal had to substitute these reductions so that its use in gross electricity generation increased by +11%. This has led to a sharp increase in coal transport promoted by falling coal prices, despite the decline in the use of coal in steel production.
- Regarding agricultural products, there has been a sharp increase (+30%) in the transport of agricultural products registered at the lock of Gambsheim on the upper Rhine, compared with 2024. This increase was notably bolstered by excellent yields and a resurgence in exports to the European Union and third countries. This trend thus confirms the strategic role of inland waterway transport for the cereals sector.8 But for the entire Rhine, the increase in agricultural products and food products taken together was only marginal.
- Container transport on the Rhine is impacted by a combination of influencing factors. One important factor is maritime container throughput in the seaports (in particular Rotterdam and Antwerp). Aa second influencing factor is logistical efficiency of IWT, which is in particular related to the transshipment of inland vessels in seaports, and a third factor is the effect of low water.
- Maritime container handling in ARA ports: for instance, the port of Rotterdam where, after a serious drop in 2022, gross weight of goods in containers handled in the port stagnated over three years (2023, 2024 and 2025). Within the first three quarters of 2025, there was only a small decrease of -1.9% compared to Q1-Q3 2024 (based on tonnes).9 The reason for the drop and the stagnation in container throughput is the Russian war of aggression against Ukraine, which caused an increase in European energy prices, reducing purchasing power, and consequently, private consumption. As containers transport a great deal of consumer goods, this has an impact on volumes.
- Permanent effect of low water: a comparison between maritime container throughput in the port of Rotterdam and container transport on the traditional Rhine (both series in tonnes) shows that the close relationship of the two variables was disrupted in Q3 and Q4 2018. In this half year, a strong low water period had a significant negative impact on container transport on the Rhine. Also, the 2022 low water period led to a renewed divergence between the Rhine data and the maritime data. These data suggest that certain severe low water periods have a long-term effect, due to modal shift towards railways.
- Logistical efficiency: congestion and long waiting times for processing inland barges at container terminals in seaports is a structural problem. It is caused by the priority given to increasingly larger seagoing vessels and weighs on the reliability and the competitive position of inland container barging.10
- The result measured in million tonnes, for container transport on the entire Rhine (from Basel to the North Sea) in 2025 was 28.9 million tonnes, which meant more or less stagnation (-0.3%). The results vary depending on the section of the Rhine in question: on the traditional Rhine, container transport was -4.4% lower than in 2024. On the Dutch section of the Rhine, national container traffic showed an increase of +4.7%, confirming the upward trend of national container transport in the Netherlands. But international traffic using only the Dutch section of the Rhine decreased by -3.6%.
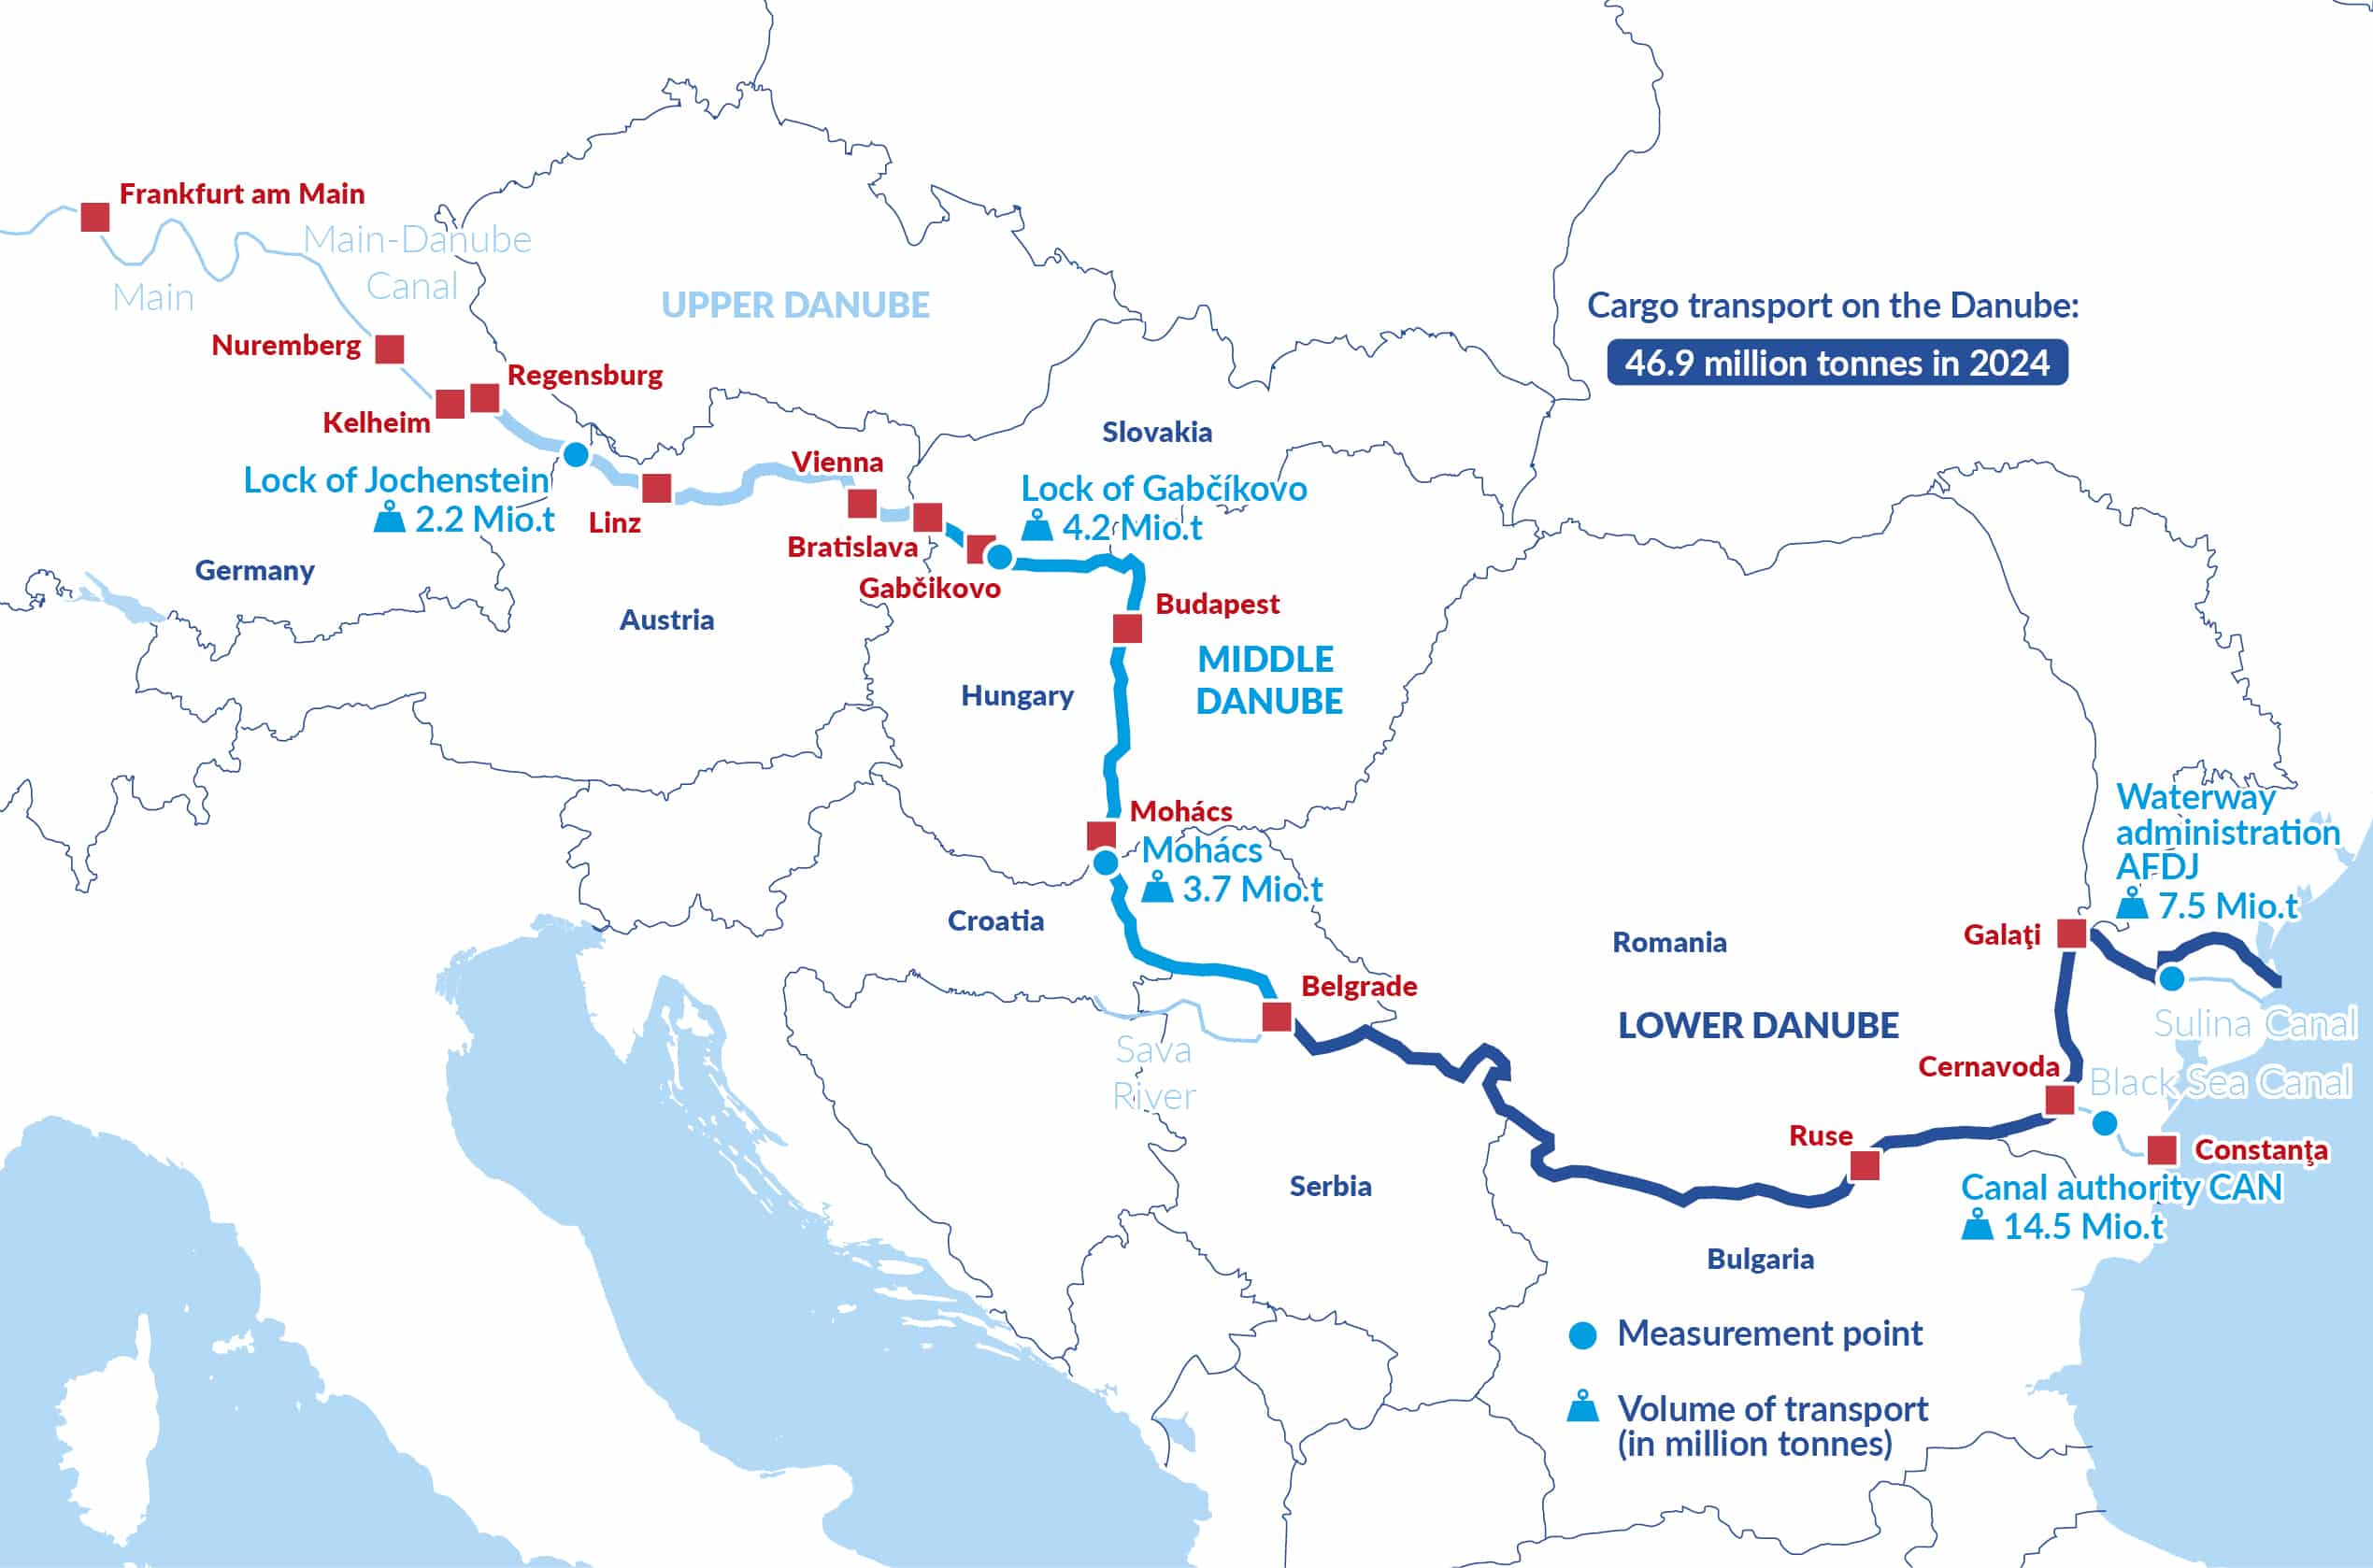
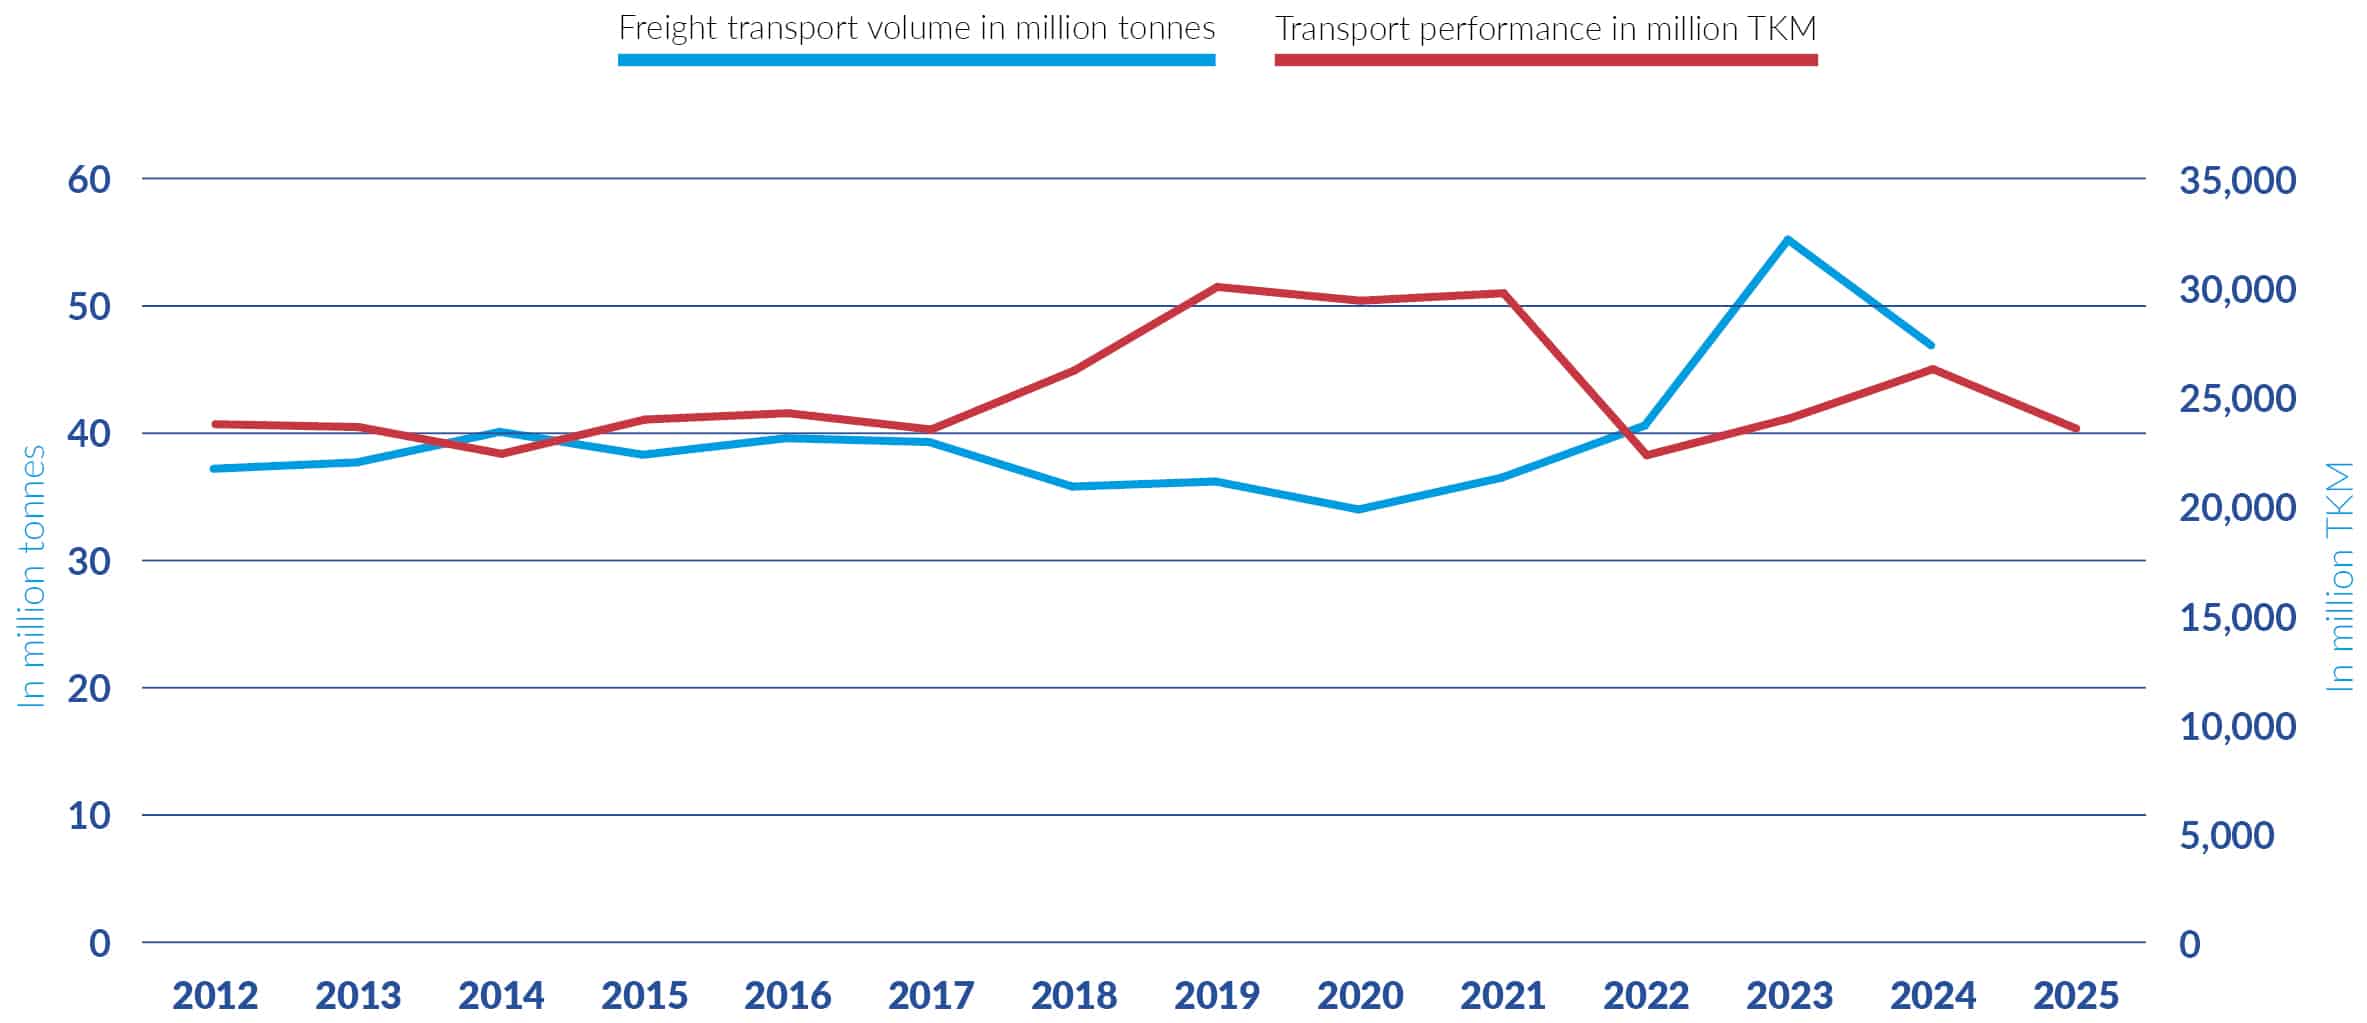
- Cargo transport on the entire navigable Danube between Kelheim (Germany) and the Black Sea via the Danube-Black Sea Canal and the Sulina Canal has been increasing since 2020 to reach 55.2 million tonnes in 2023. This increase was mainly driven by the exceptional growth in IWT volumes recorded in Ukraine, especially exports via Ukrainian Danube ports. In 2024, a -15% decrease was observed compared to 2023, reaching 46.9 million tonnes. This decrease is mainly linked with the resumption of activities in Ukrainian ports. Transport performance on the Danube (EU Danube countries plus Serbia) reached 23.6 billion TKM in 2025, a decrease of -10.4% compared to 2024.
- In the year 2025, the Russian war of aggression against Ukraine continued to have an influence on goods and passenger transport on the Danube. Throughout 2025, Russia intensified its systematic attacks on Ukrainian port infrastructure along the Danube and the neighbouring regions. Since January, when the first attack on the region around the Port of Izmail took place, Russia has carried out air strikes every month on Ukrainian port infrastructure along the Danube and adjacent facilities. These attacks resulted in the destruction of transhipment facilities, energy and transport infrastructure, grain silos, warehouses and administrative buildings. Furthermore, various ships flying foreign flags sustained damage whilst loading and unloading.
- The air and mine attacks carried out by Russia have posed direct threats not only to Ukraine’s port infrastructure on the Danube, but also to the entire shipping system on the lower Danube, including the safety of ship crews and personnel.
- The critical situation in the lower Danube region, resulting from Russia’s full-scale aggression against Ukraine, continued to be the determining factor in the dynamics and final market indicators for Danube navigation. Consequently, the Danube navigation market faced serious challenges, primarily regarding the safety of navigation and additional risks which, in turn, led to a partial reorientation of the market and distortions in certain sectors of traditional shipping on the Danube.
- Against the backdrop of the situation described above, the Danube Commission will actively continue its efforts to comprehensively promote the export of Ukrainian agricultural products and the import of goods required by Ukraine, within the framework of the ‘Danube Solidarity Lanes EU-Ukraine’ initiative adopted in May 2022 to support the European Union’s solidarity measures for Ukraine. The focus was on stabilising freight transport logistics chains using the Danube ports in Ukraine, the Republic of Moldova and Romania, as well as the Danube-Black Sea Canal link.
- In 2025, there was a sharp decline in cargo transport on the Danube at all available measurement points. This can be explained by weak economic framework conditions, unfavourable water conditions (see chapter 3) and the ongoing Russian war of aggression against Ukraine.
- At the most representative measurement point, Gabčíkovo at the Slovakian-Hungarian border, the transport of food products and foodstuff in particular declined strongly. Also, iron ore transport was lower than in 2024. The goods segments with an increase were mineral oil products, metals and fertilisers.
- The following figure illustrates the development of cargo transport by goods segment on the upper Danube.
- In 2025, with 11.1 billion TKM (-1.9%), more than 5.7 million TEU (+0.4%) and 46.4 million tonnes of cargo in containers (-1.1%), container transport on EU inland waterways (EU-27) represented 9.4% of the total IWW transport performance of approximately 118.0 billion TKM in the EU. Moreover, more than 99% of the container transport performance (TKM) took place in Rhine countries (the Netherlands, Belgium, Germany, France, Switzerland, Luxembourg). Container transport on the Danube accounted for 0.1%.
- In 2025, container transport measured in TEU increased by +5.0% in the Netherlands only. It remained stable in Germany and regressed by -8.7% in France, and by -7.8% in Belgium. In the Netherlands, 41.8 million tonnes of cargo were transported in containers (+2.1%) corresponding to 4.8 million TEU (+5.0%), making this country by far the frontrunner in inland waterway container transport in Europe. The Netherlands experienced growth in both domestic and international container transport, whether assessed in TEU or TKM. Germany presented a mixed picture, with domestic container transport expanding while international movements contracted across both metrics. By contrast, Belgium recorded declines in both domestic and international container transport, measured either in TEU or TKM.
- The two Danube countries with the highest container transport are currently Romania and Hungary. In 2025, 276 TEU (+91.8%) were transported on Hungarian inland waterways. In Romania, container transport amounted to 4,544 TEU in 2025 (-77.9%). Considering the weight of cargo, container transport on Hungarian waterways represented 8,000 tonnes in 2025 (+60.0%). In Romania, 66,000 tonnes of cargo were transported in containers (-72.2%). These values illustrate the immense gap in relation to Rhine countries.
- Over the past decade, the modal share of inland waterway transport (IWT) and rail has declined at EU 27 level, while road transport has gained ground. IWT accounted for 5.2% in 2024 (-2 percentage points over ten years), although this was its first year on year increase since 2019. Despite this improvement, IWT remains far behind road transport, which accounted for 78.2% in 2024 (+4 percentage points over ten years), and rail transport, with a 16.6% share (-2 percentage points). As many EU Member States have no inland waterways, the EU level modal split is not a suitable performance indicator for IWT. Modal split figures should therefore be assessed at national level.
- Over the past decade, the modal share of inland waterway transport (IWT) has declined in all main IWT countries. In the Netherlands, IWT peaked at 46.8% in 2012 before falling to 40.4% in 2024. Long term declines were also observed in Germany, Belgium, Luxembourg and France. In Germany, the IWT share dropped below 7.0% in 2022 and 2023, before rising back to 7.0% in 2024 for the first time since 2019. Belgium and Luxembourg followed a comparable pattern, with a sustained decline after 2019 and a recovery in 2024.
- In Danube countries, Romania and Bulgaria recorded higher IWT shares (above 28.0%) before 2020, followed by sharp decreases in 2021–2022. Since then, both countries have partially recovered, with gains of around 3 percentage points in Romania and 5 percentage points in Bulgaria between 2022 and 2024. The remaining Danube countries also saw an increase in IWT modal share in 2024, their first year on year rise since 2019.
- Overall, despite the widespread rebound in 2024, all countries analysed still report lower IWT modal shares than ten years ago (around -5 percentage points in the Netherlands, Belgium and Hungary; -3 in Germany; and -6 in Romania). The long-term decline can be attributed to a combination of factors such as:
– structural advantages of road transport,
– changes in industrial structure (decline in heavy bulk industries, growth sectors relying less on IWT),
– logistical patterns leading to a reduced demand for IWT across most countries (just-in-time delivery),
– limitations relating to network coverage and reliability, delays in maintenance and renovation of locks and bridges, insufficient investment in inland waterway infrastructure. - The IWT modal share increase observed in 2024 therefore appears to reflect a rebound from lower levels in previous years and renewed demand for bulk transport following the energy and raw materials shocks, rather than a reversal of the underlying downward trend.
TRANSPORT PERFORMANCE IN IWT ON THE NATIONAL TERRITORY OF EACH COUNTRY IN EUROPE – COMPARISON BETWEEN 2024 AND 2025 (IN MILLION TKM) *
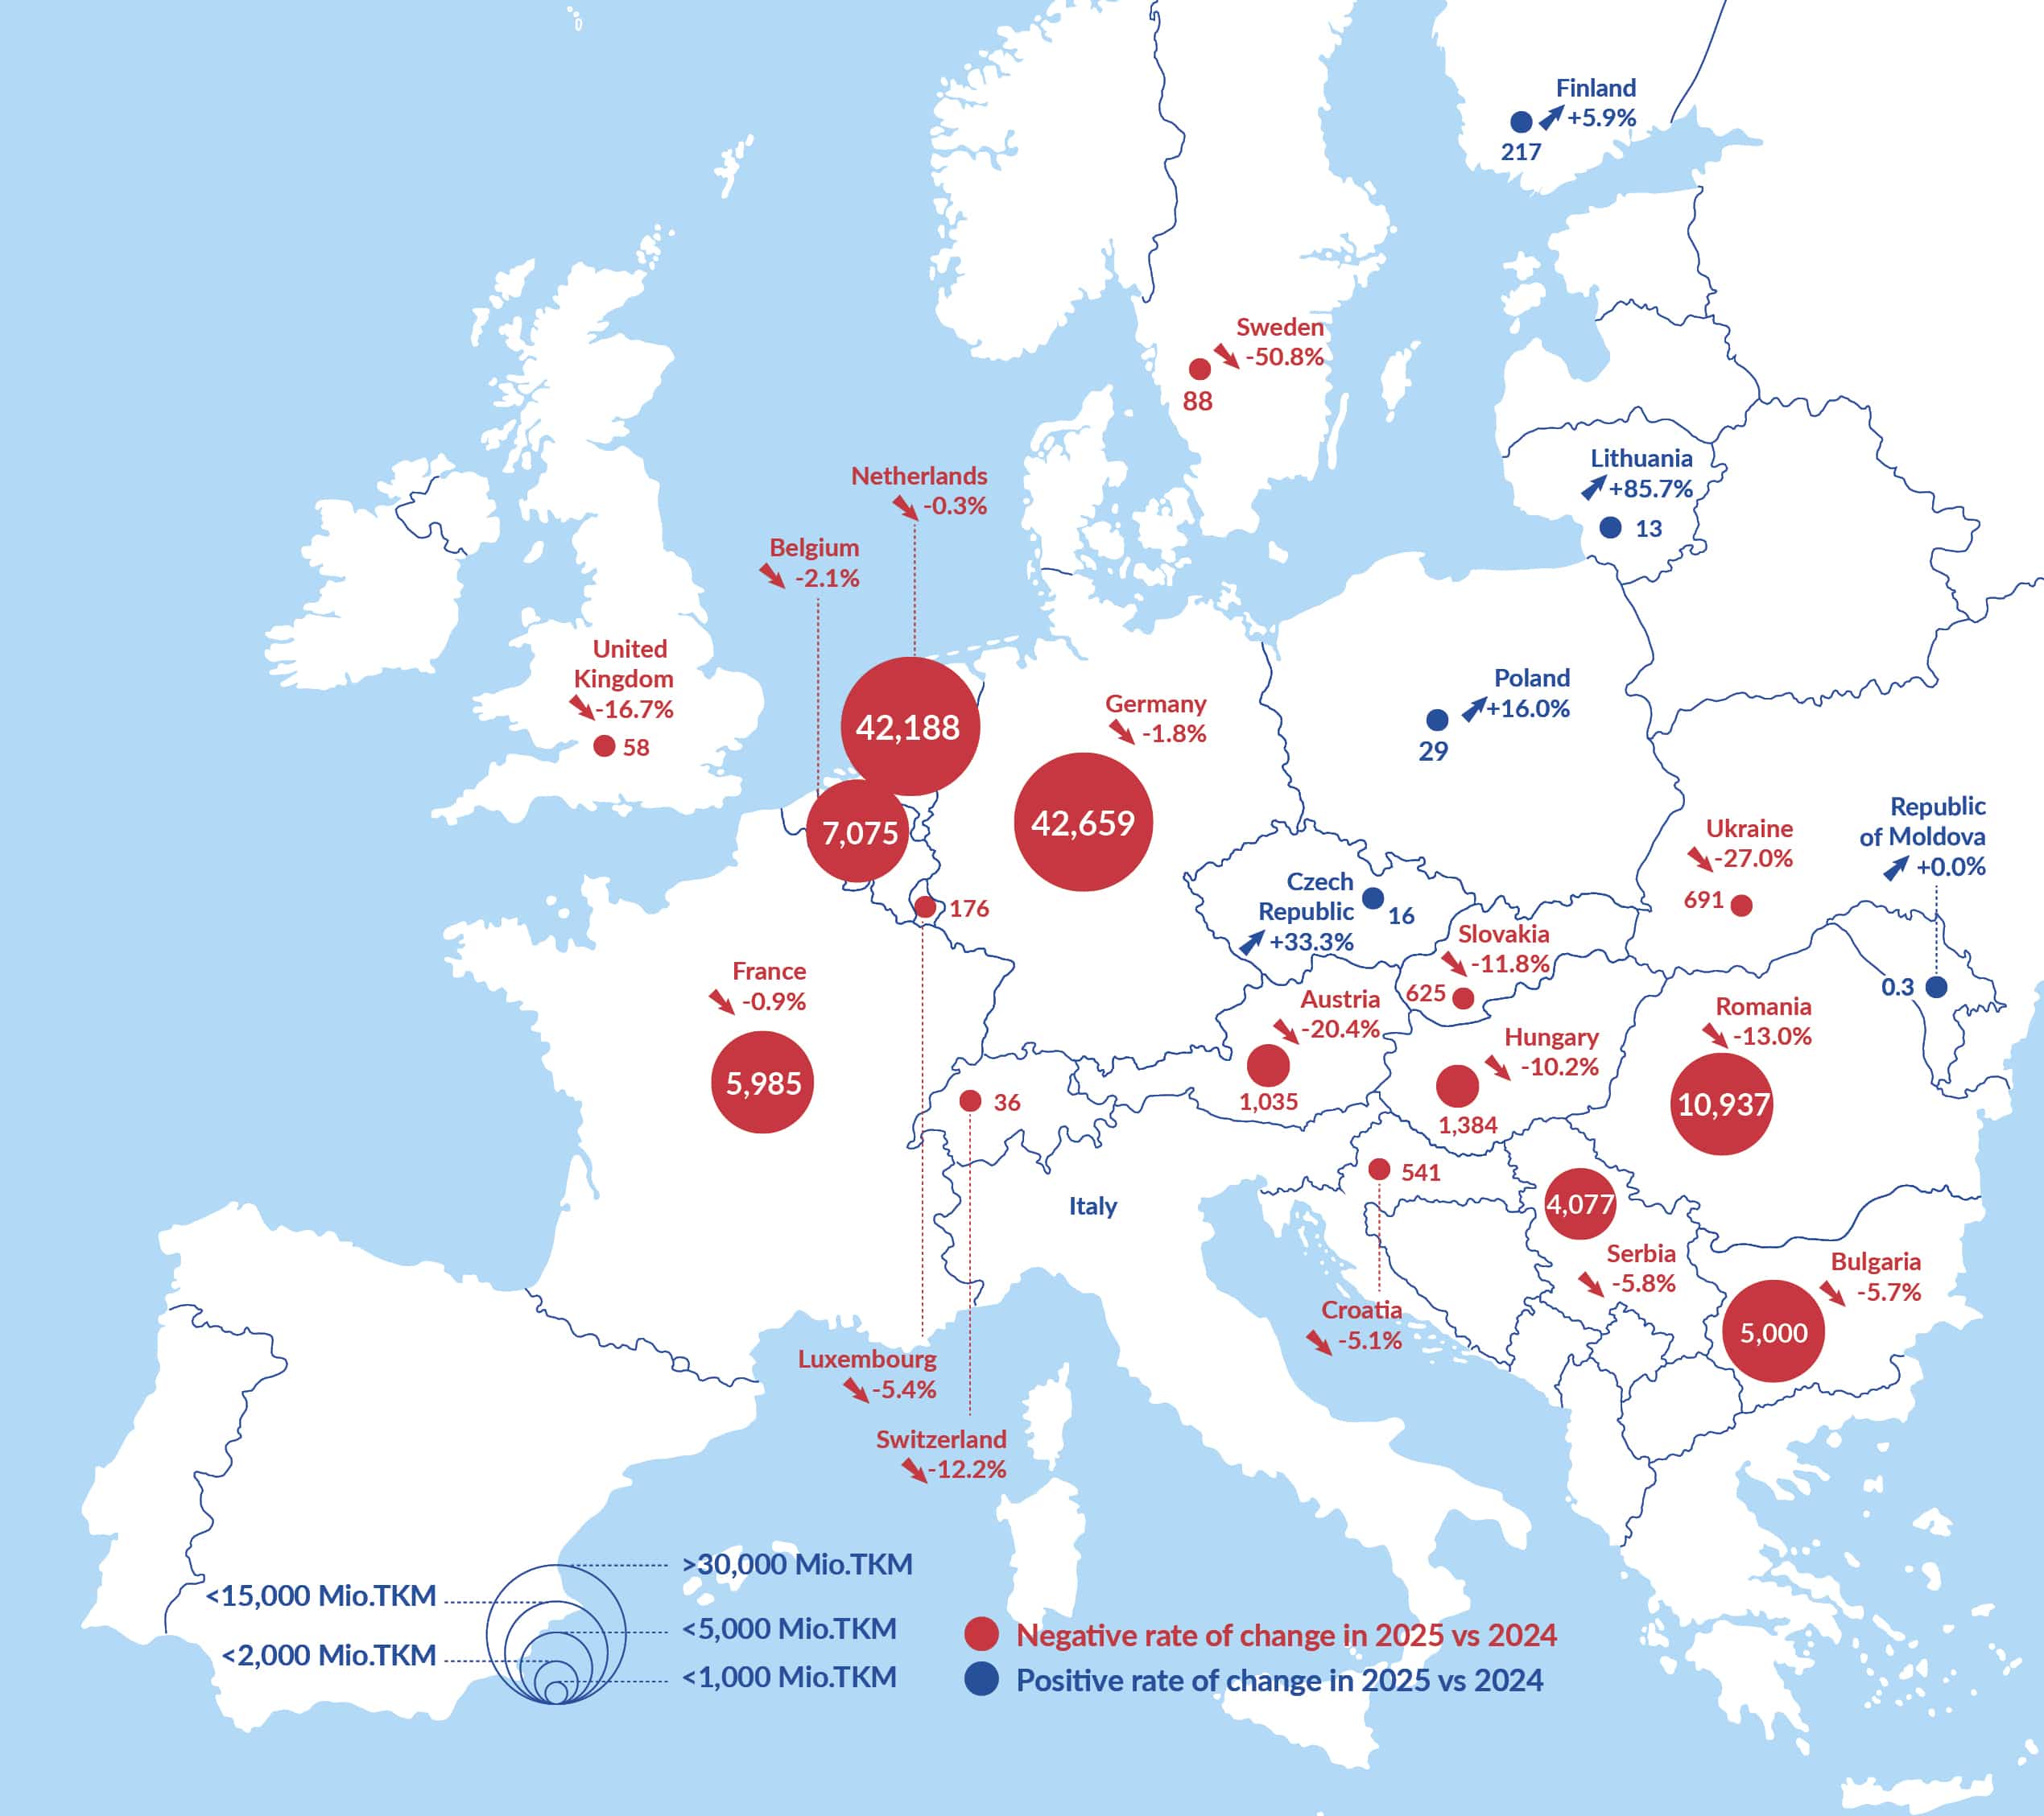
Sources: Eurostat [iww_go_atygo] and [iww_go_qnave], OECD (Switzerland, Ukraine and the Republic of Moldova), UK Department for Transport
* The share of IWT performance in Europe in 2025 for Italy is not available.
FIGURE 1: IWT TRANSPORT PERFORMANCE BETWEEN 2018 AND 2025 IN MAIN EUROPEAN IWT COUNTRIES (IN BILLION TKM) *
ch2_fig1_raw data
Sources: Eurostat [iww_go_atygo] (for most countries) and [iww_go_qnave] (Serbia), OECD (Switzerland, Ukraine and the Republic of Moldova), UK Department for Transport (UK)
* The values for Italy (2025) and Finland (2018) are not available.
Note: for the UK, IWT is defined as non-seagoing traffic which takes place entirely within inland waters and river-sea transport (seagoing vessels navigating partly at sea and on inland waterways). In this figure, for the sake of consistency with the methodology used by Eurostat, only the transport performance related to the traffic taking place wholly within inland waters is reported (amounting to 58 million TKM in 2025). However, it is worth noting that most of IWT in the UK consists of river-sea transport (amounting to almost 1.1 billion TKM in 2025). Overall, the IWT performance in the UK is reported to reach almost 1.2 billion TKM in 2025.
FIGURE 2: INLAND WATERWAY TRANSPORT PERFORMANCE IN EUROPEAN COUNTRIES IN 2025 (IN BILLION TKM) *
ch2_fig2_raw data
Sources: Eurostat [iww_go_atygo] (for most countries) and [iww_go_qnave] (Serbia), OECD (Switzerland, Ukraine and the Republic of Moldova)
* Data for Italy were not available for 2025.
FIGURE 3: YEARLY INLAND WATERWAY TRANSPORT PERFORMANCE IN THE EU-27 (IN BILLION TKM) *
ch2_fig3_raw data
Source: Eurostat [iww_go_atygo]
* EU-27 according to member countries in 2025.
TRANSPORT BY MAIN EUROPEAN RIVER BASINS
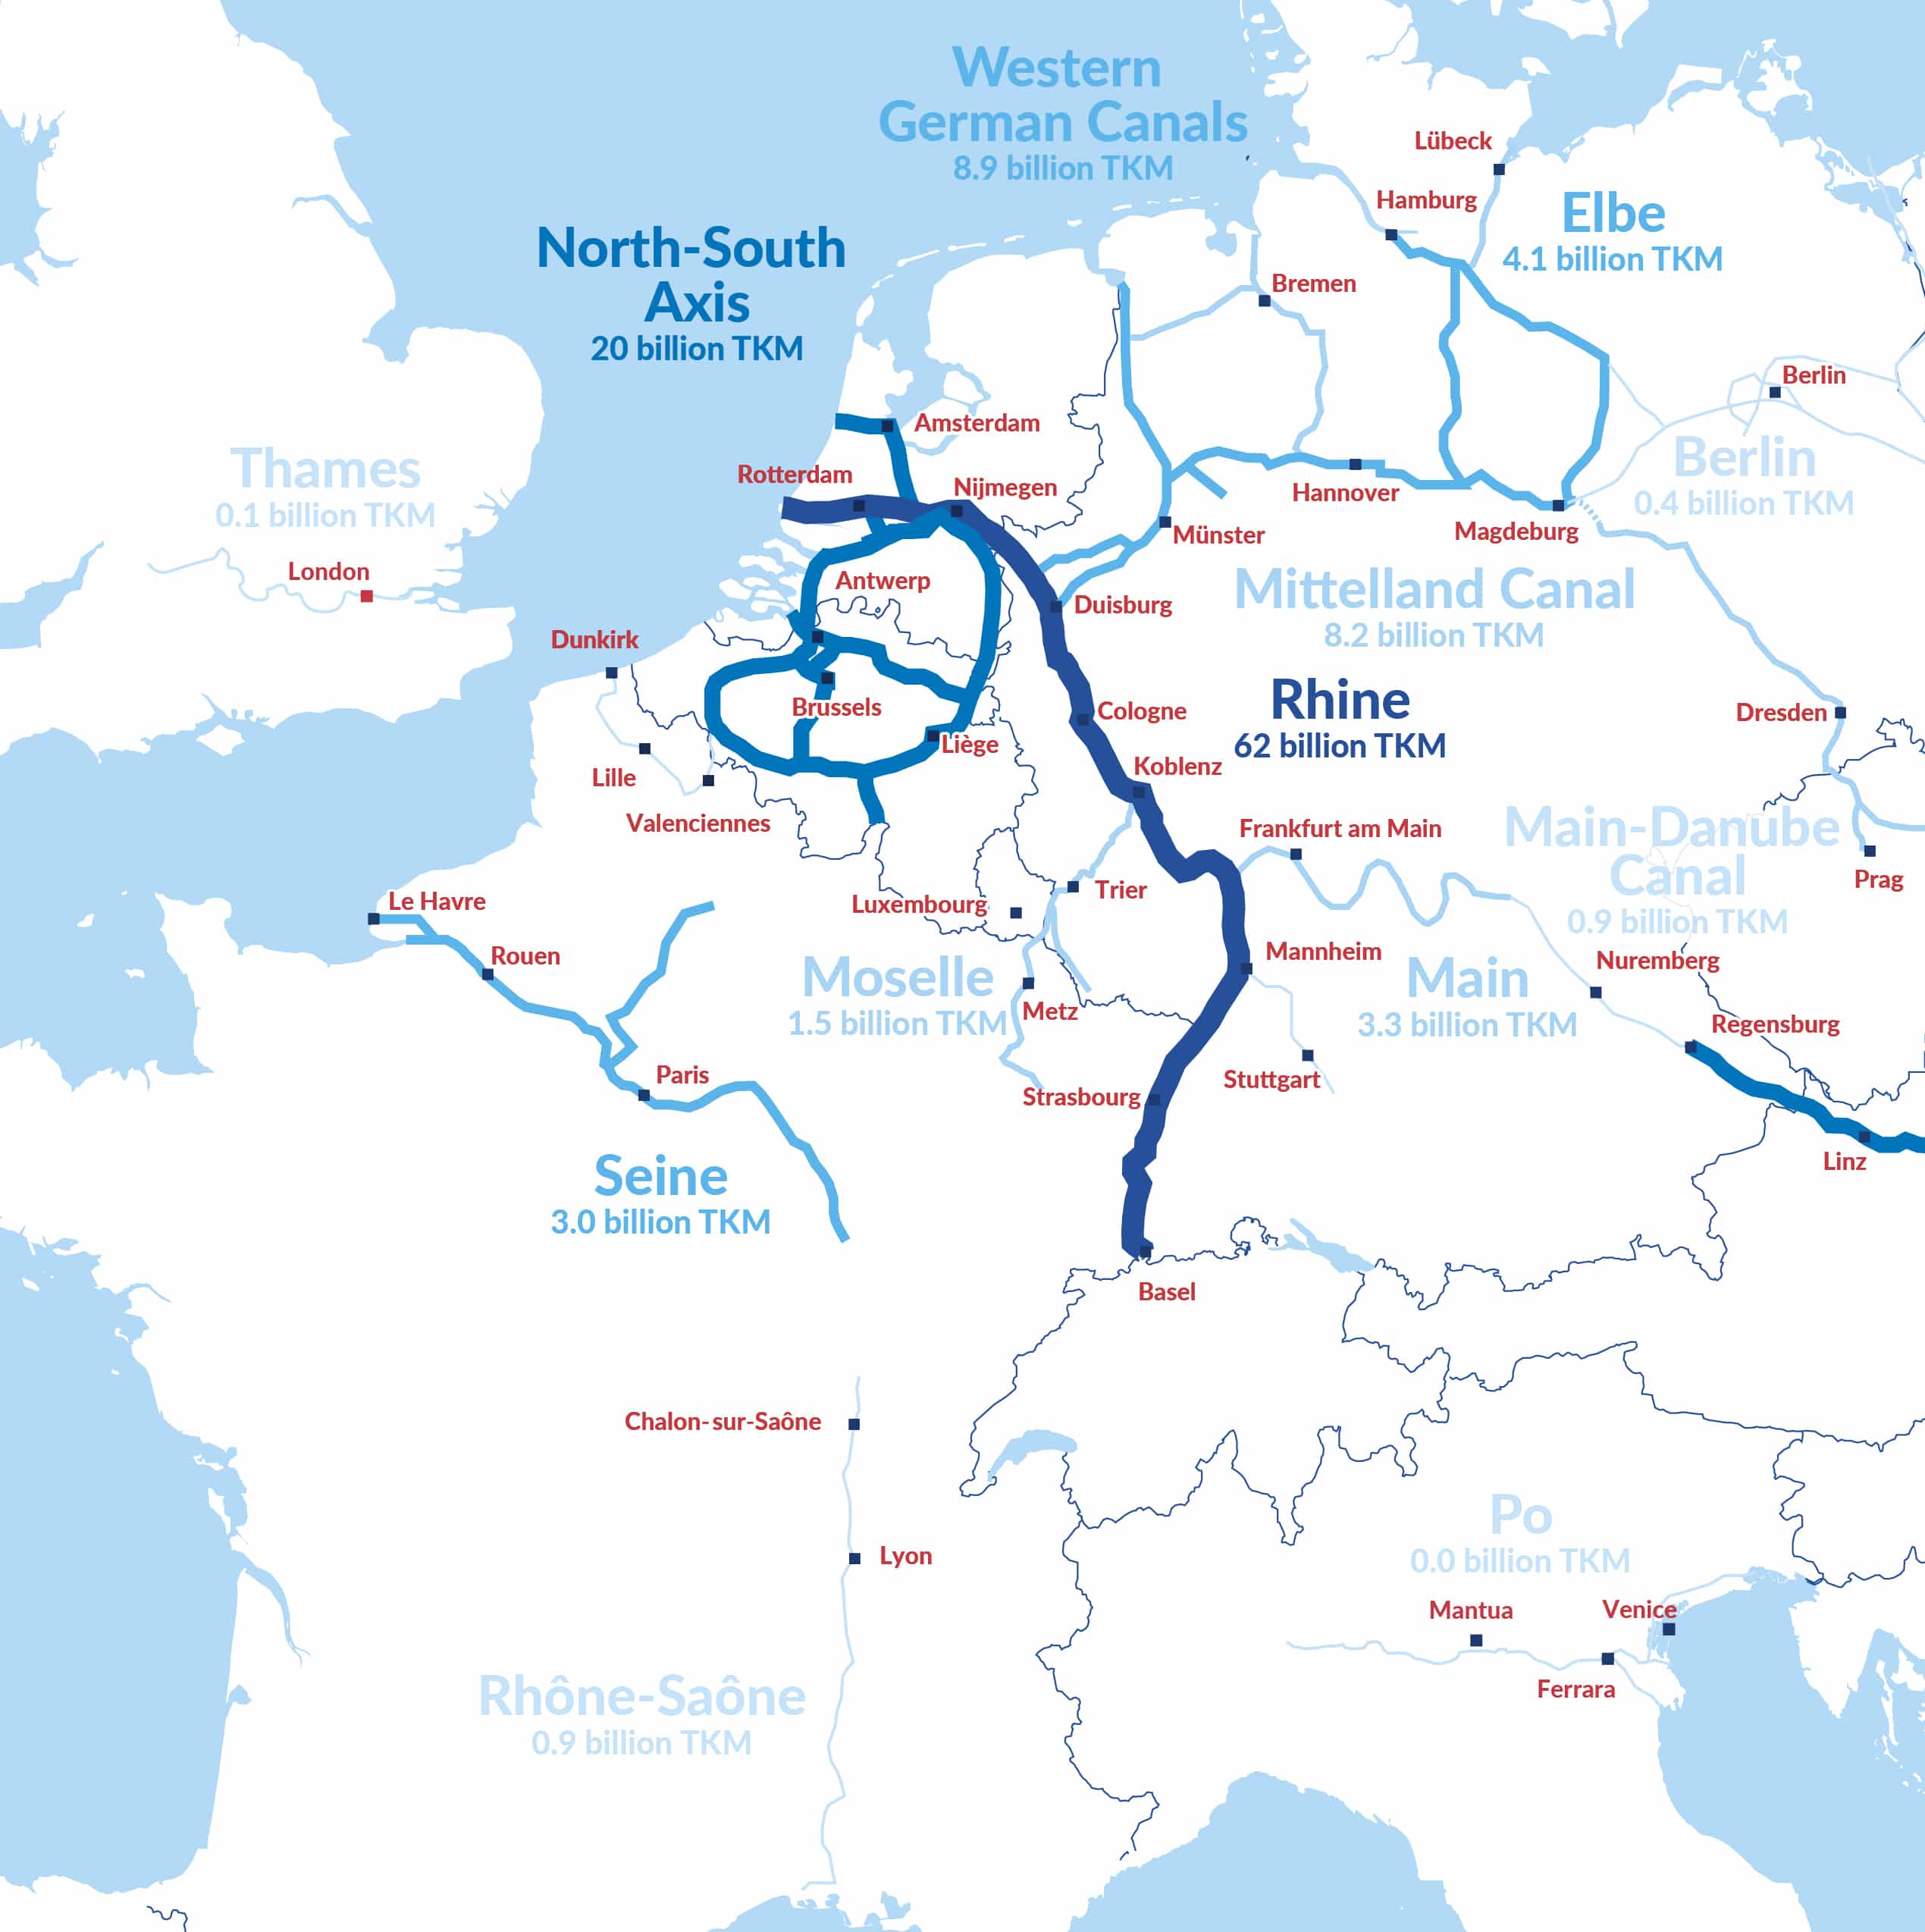
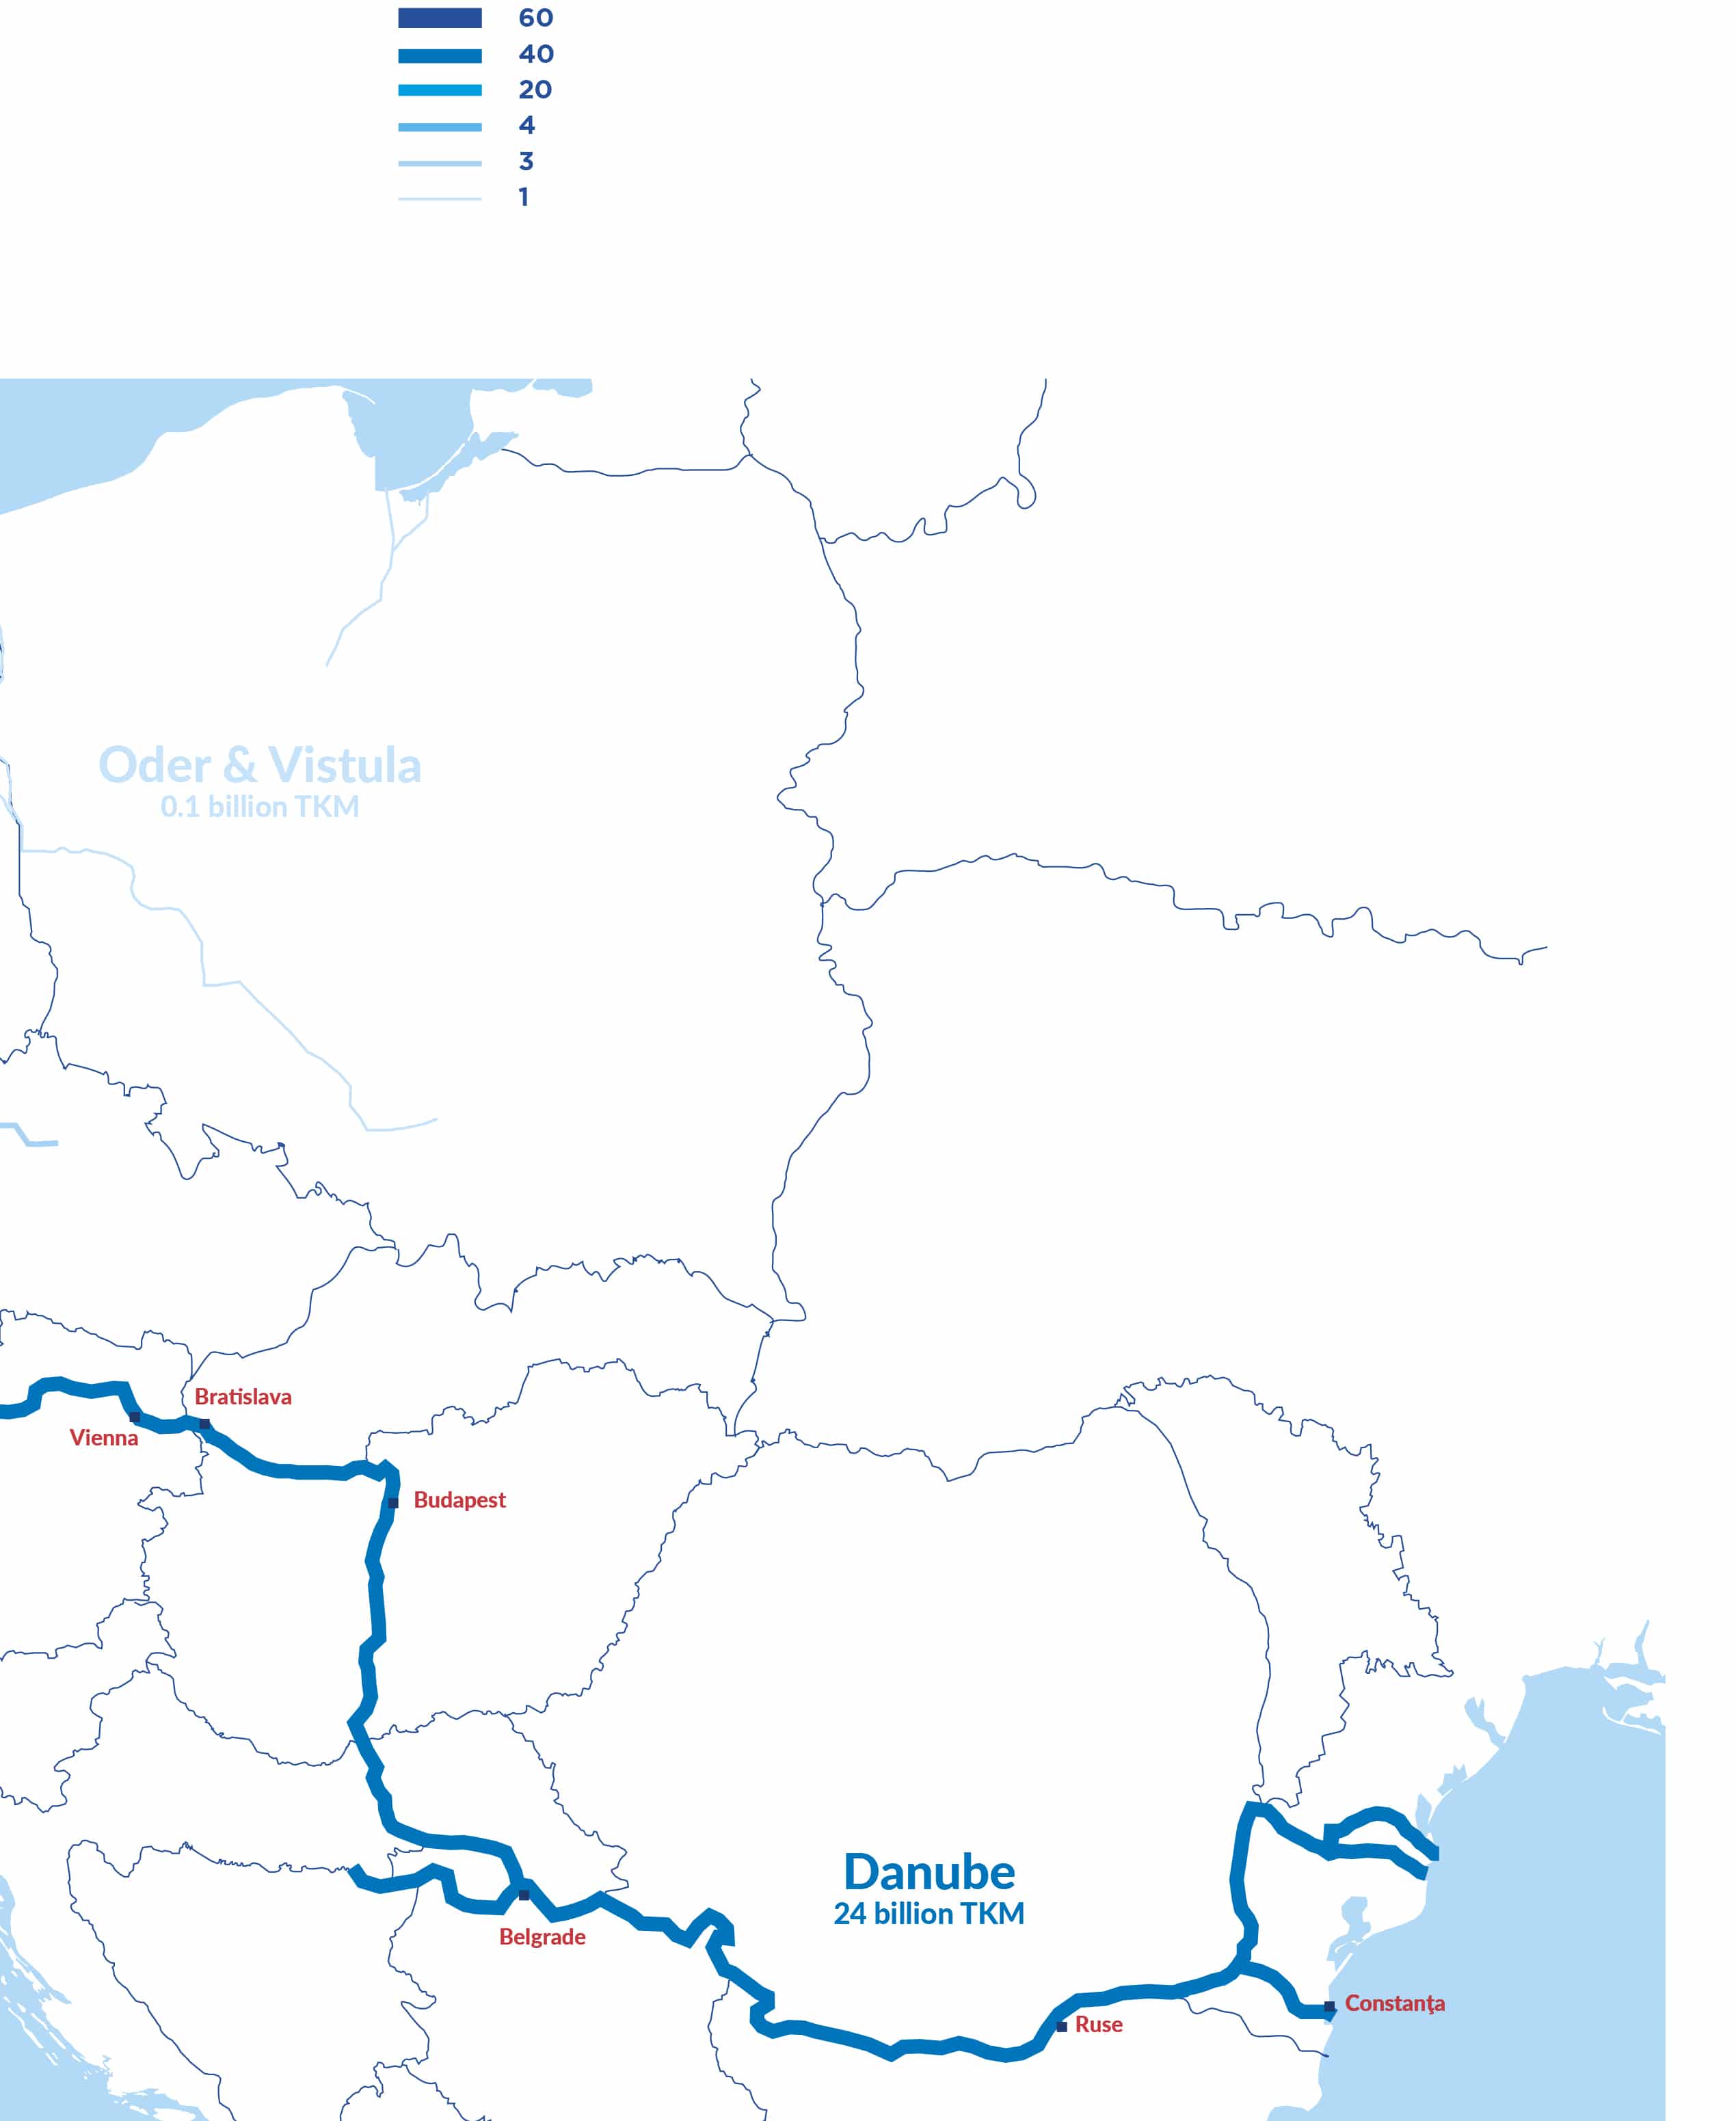
Sources: CCNR analysis based on Destatis, Voies navigables de France (VNF), Eurostat [iww_go_atygo], UK Department for Transport.
RHINE BASIN
Sources: Destatis (Emmerich), WSV, VNF, Moselle Commission, Swiss Rhine Ports
Transport volume and transport performance on the entire Rhine (from Basel to the North Sea)
FIGURE 4: FREIGHT TRANSPORT VOLUME (IN MILLION TONNES) ON THE ENTIRE RHINE *
ch2_fig4_raw data
Sources: CCNR analysis based on Destatis, VNF (data for the traditional Rhine) and Rijkswaterstaat (data for the lower Rhine in the Netherlands)
* Note that the traditional Rhine data capture all cargo transport on the Rhine in Germany as well as more refined data for the parts of the upper Rhine reflecting traffic between French Rhine ports and between Swiss and French Rhine ports. Note that the latter represent less than 1% of all transport volumes on the entire Rhine.
FIGURE 5: TRANSPORT PERFORMANCE (IN MILLION TKM) ON THE ENTIRE RHINE
ch2_fig5_raw data
Sources: CCNR analysis based on Destatis, VNF (data for the traditional Rhine) and Rijkswaterstaat (data for the lower Rhine in the Netherlands)
Transport activity on different stretches of the Rhine, on Rhine affluents and on canals linked to the Rhine
FIGURE 6: FREIGHT TRANSPORT ON THE DIFFERENT STRETCHES OF THE RHINE (IN MILLION TONNES) *
ch2_fig6_raw data
Sources: CCNR analysis based on Destatis (lower, middle and upper Rhine in Germany), VNF (upper Rhine in France and Switzerland) and Rijkswaterstaat (lower Rhine delta in the Netherlands)
* To avoid double counting, the volumes on the different stretches of the Rhine cannot be added together, as certain volumes are present on several Rhine stretches.
Rhine transport by cargo segment
FIGURE 7: CARGO TRANSPORT ON THE ENTIRE RHINE * BY TYPE OF GOODS (IN MILLION TONNES) **
ch2_fig7_1_raw data
ch2_fig7_2_raw data
Sources: CCNR analysis based on Destatis, VNF and Rijkswaterstaat
* Entire Rhine = Rhine from Rheinfelden (CH) to the North-Sea (including link to Antwerp via the Rhine-Scheldt link)
** For containers: net-weight of goods in containers
Sources: CCNR analysis based on data from Eurostat [sts_inpr_q] Manufacture of chemicals and chemical production, [apro_cpsh1] Production in main cereals, [sts_copr_a] Production in construction, [mar_qg_qm_pwhc] Gross weight of goods in containers handled in each port, and based on data provided by the German Steel Federation, the German Federal Waterways and Shipping Administration (WSV), the German Federal Institute of Hydrology (BfG), German Meteorological Service (temperature data), Investing.com London (gasoil spreads), German Working Group on Energy balances (coal statistics), Association of German Coal importers (VDKI) (on the share of coal used in different sectors, Destatis (coal prices), VNF.
Container transport on the Rhine
FIGURE 8: CONTAINER TRANSPORT ON THE TRADITIONAL RHINE AND THE LOWER RHINE IN THE NETHERLANDS (IN MILLION TONNES, NET WEIGHT OF GOODS IN CONTAINERS), 2014-2025 *
ch2_fig8_raw data
Sources: CCNR analysis based on Destatis, VNF and Rijkswaterstaat
* Traditional Rhine = Rhine from Rheinfelden (CH) to the German-Dutch border; Dutch section of the Rhine = Rhine from the German-Dutch border to the North Sea (including link to Antwerp via the Rhine-Scheldt link)
Note that the traditional Rhine data capture all cargo transport on the Rhine in Germany, as well as more refined data for the parts of the upper Rhine, which reflect traffic between French Rhine ports and between Swiss and French Rhine ports.
FIGURE 9: CONTAINER TRANSPORT ON THE TRADITIONAL RHINE AND THE LOWER RHINE IN THE NETHERLANDS (IN MILLION TEU), 2014-2025 *
ch2_fig9_raw data
Sources: CCNR analysis based on Destatis, VNF (only for the period 2020-2024) and Rijkswaterstaat
* Traditional Rhine = Rhine from Rheinfelden (CH) to the German-Dutch border; Dutch section of the Rhine = Rhine from the German-Dutch border to the North Sea (including link to Antwerp via the Rhine-Scheldt link).
DANUBE BASIN
Transport volume and transport performance on the Danube
FIGURE 10: FREIGHT TRANSPORT VOLUME (IN MILLION TONNES) AND TRANSPORT PERFORMANCE (IN MILLION TKM) ON THE DANUBE *
ch2_fig10_raw data
Sources: for transport volumes – viadonau, Annual reports on Danube navigation; for transport performance – Eurostat [iww_go_atygo] and [iww_go_qnave] (Serbia)
* Transport performance in IWT in all EU Danube countries.
Danube transport at specific measurement points
Danube transport by cargo segment
FIGURE 11: GOODS TRANSPORT ON THE UPPER DANUBE (IN MILLION TONNES) *
ch2_fig11_raw data
Source: Danube Commission market observation report
* At Gabčíkovo (border Slovakia-Hungary)
CONTAINER TRANSPORT PER COUNTRY IN EUROPE
THE WHOLE EUROPEAN AND GEOGRAPHICAL STRUCTURE
RHINE COUNTRIES
FIGURE 12: IWW CONTAINER TRANSPORT PER RHINE COUNTRY (IN MILLION TEU) *
ch2_fig12_raw data
Source: Eurostat [iww_go_actygo] and [iww_go_qcnave]
* In Luxembourg, 9,995; 10,750; 8,518 and 4,624 TEU were recorded for 2022, 2023, 2024 and 2025 respectively.
DANUBE COUNTRIES
INLAND NAVIGATION AND OTHER MODES OF TRANSPORT
FIGURE 13: MODAL SPLIT SHARE OF INLAND TRANSPORT MODES IN THE EU-27 (IN %) 2009-2024
ch2_fig13_raw data
Source : Eurostat [tran_hv_frmod]
FIGURES 14 AND 15: IWW MODAL SPLIT EVOLUTION IN RHINE AND DANUBE COUNTRIES (IN %, BASED ON TONNE-KILOMETRES) *
ch2_fig14_raw data
ch2_fig15_raw data
Source: Eurostat [tran_hv_frmod]
* Share of inland waterway transport performance in total (IWT + Road + Rail) transport performance