


• The European river cruise sector continued to expand in 2025, supported by growing demand and renewed investment. The active fleet reached 420 vessels in 2025, compared to 408 in 2024. Fourteen new river cruise vessels entered the market during the year, adding 2,182 beds, while a further 17 vessels are expected in 2026, and 25 in 2027, based on current order books.
• River cruise demand continued to grow in 2025, with 1.5 million passengers travelling on European rivers (+8.0% compared to 2024) and generating 3.7 billion euro in gross ticket sales (+5.0%). The Rhine and Danube accounted for around 80% of all destination choices in 2025. Passenger numbers reached almost 823,000 at Lobith, lower Rhine (+2.1%) and 503,000 at Gambsheim, upper Rhine (+9.8%), while on the upper Danube 650,354 passengers were recorded at Jochenstein (+35.9%). River cruise vessel movements on the Rhine were still below the pre-pandemic level, in contrast to passenger numbers. On the Danube, vessel movements were far above the pre-pandemic levels. This exceptional boom was also influenced by a relocation of the starting point of cruise vessels from Engelhartszell (downstream of Jochenstein) to Passau (upstream of Jochenstein).
• On the Moselle, they were slightly higher than in 2019. Data for capacity utilisation are available for the upper Danube and indicate a rate of 74.0% in 2025, the highest level since 2019.
RIVER CRUISE FLEET AND DEMAND
- The active river cruise fleet in Europe,37 which represents more than 40% of the world active river cruise fleet, is mainly concentrated on central European waterways,38 accounting for nearly 72% of the total river cruise fleet in Europe. The number of active river cruise vessels in Europe in 2025 amounted to 42039 (compared with 408 in 2024). This number is expected to reach 426 in 2026.
- Some vessels – in parallel with their cruising activities outside the main touristic seasons – are being used as floating hotels. This remained true in 2025, with 14 vessels (included within the total of 420 active river cruise vessels) being used as floating hotels (compared to 18 in 2024 and 16 in 2023). Some of these are expected to fully resume their cruising activities in 2026.
- Since Covid-19, the newbuilding activity for river cruises remained rather slow between 2022 and 2024. However, the activity picked up again in 2025, with 14 new river cruise vessels coming onto the market (compared to 6 in 2024). The order book for 2026 and 2027 also confirms this positive trend with 17 new river cruise vessels expected in 2026 and 25 in 2027.
- In 2025, the 14 new vessels brought an additional capacity of 2,182 (compared to 948 beds in 2024) to the river cruise market in Europe. An additional capacity of 2,730 beds is expected for the year 2026.
- The European river cruise industry continued to grow between 2024 and 2025 with both passenger numbers and revenues increasing, although at a slower pace than in the previous season. In 2025, 1.5 million passengers travelled on European rivers (+8.0% compared with 2024) and generated 3.7 billion euro in gross ticket sales (+5.0%). Non-European customers represented 45% of passengers but contributed 66% of total revenue, reflecting a longer average length of stay than European guests.
- According to the IG River Cruise study, the Rhine and the Danube (including their tributaries) remain the backbone of the European river cruise market, together accounting for around 80% of passengers’ destination choices in the 2025 season. Most passengers came from the DACH region42 (586,801 customers – 39.4% of total passengers) and from the USA/Canada (544,819 customers – 36.6% of total passengers).
- In terms of passenger age, the 56–75 years of age segment continued to dominate the European river cruise market, while demand from travellers under 40 years remained limited.
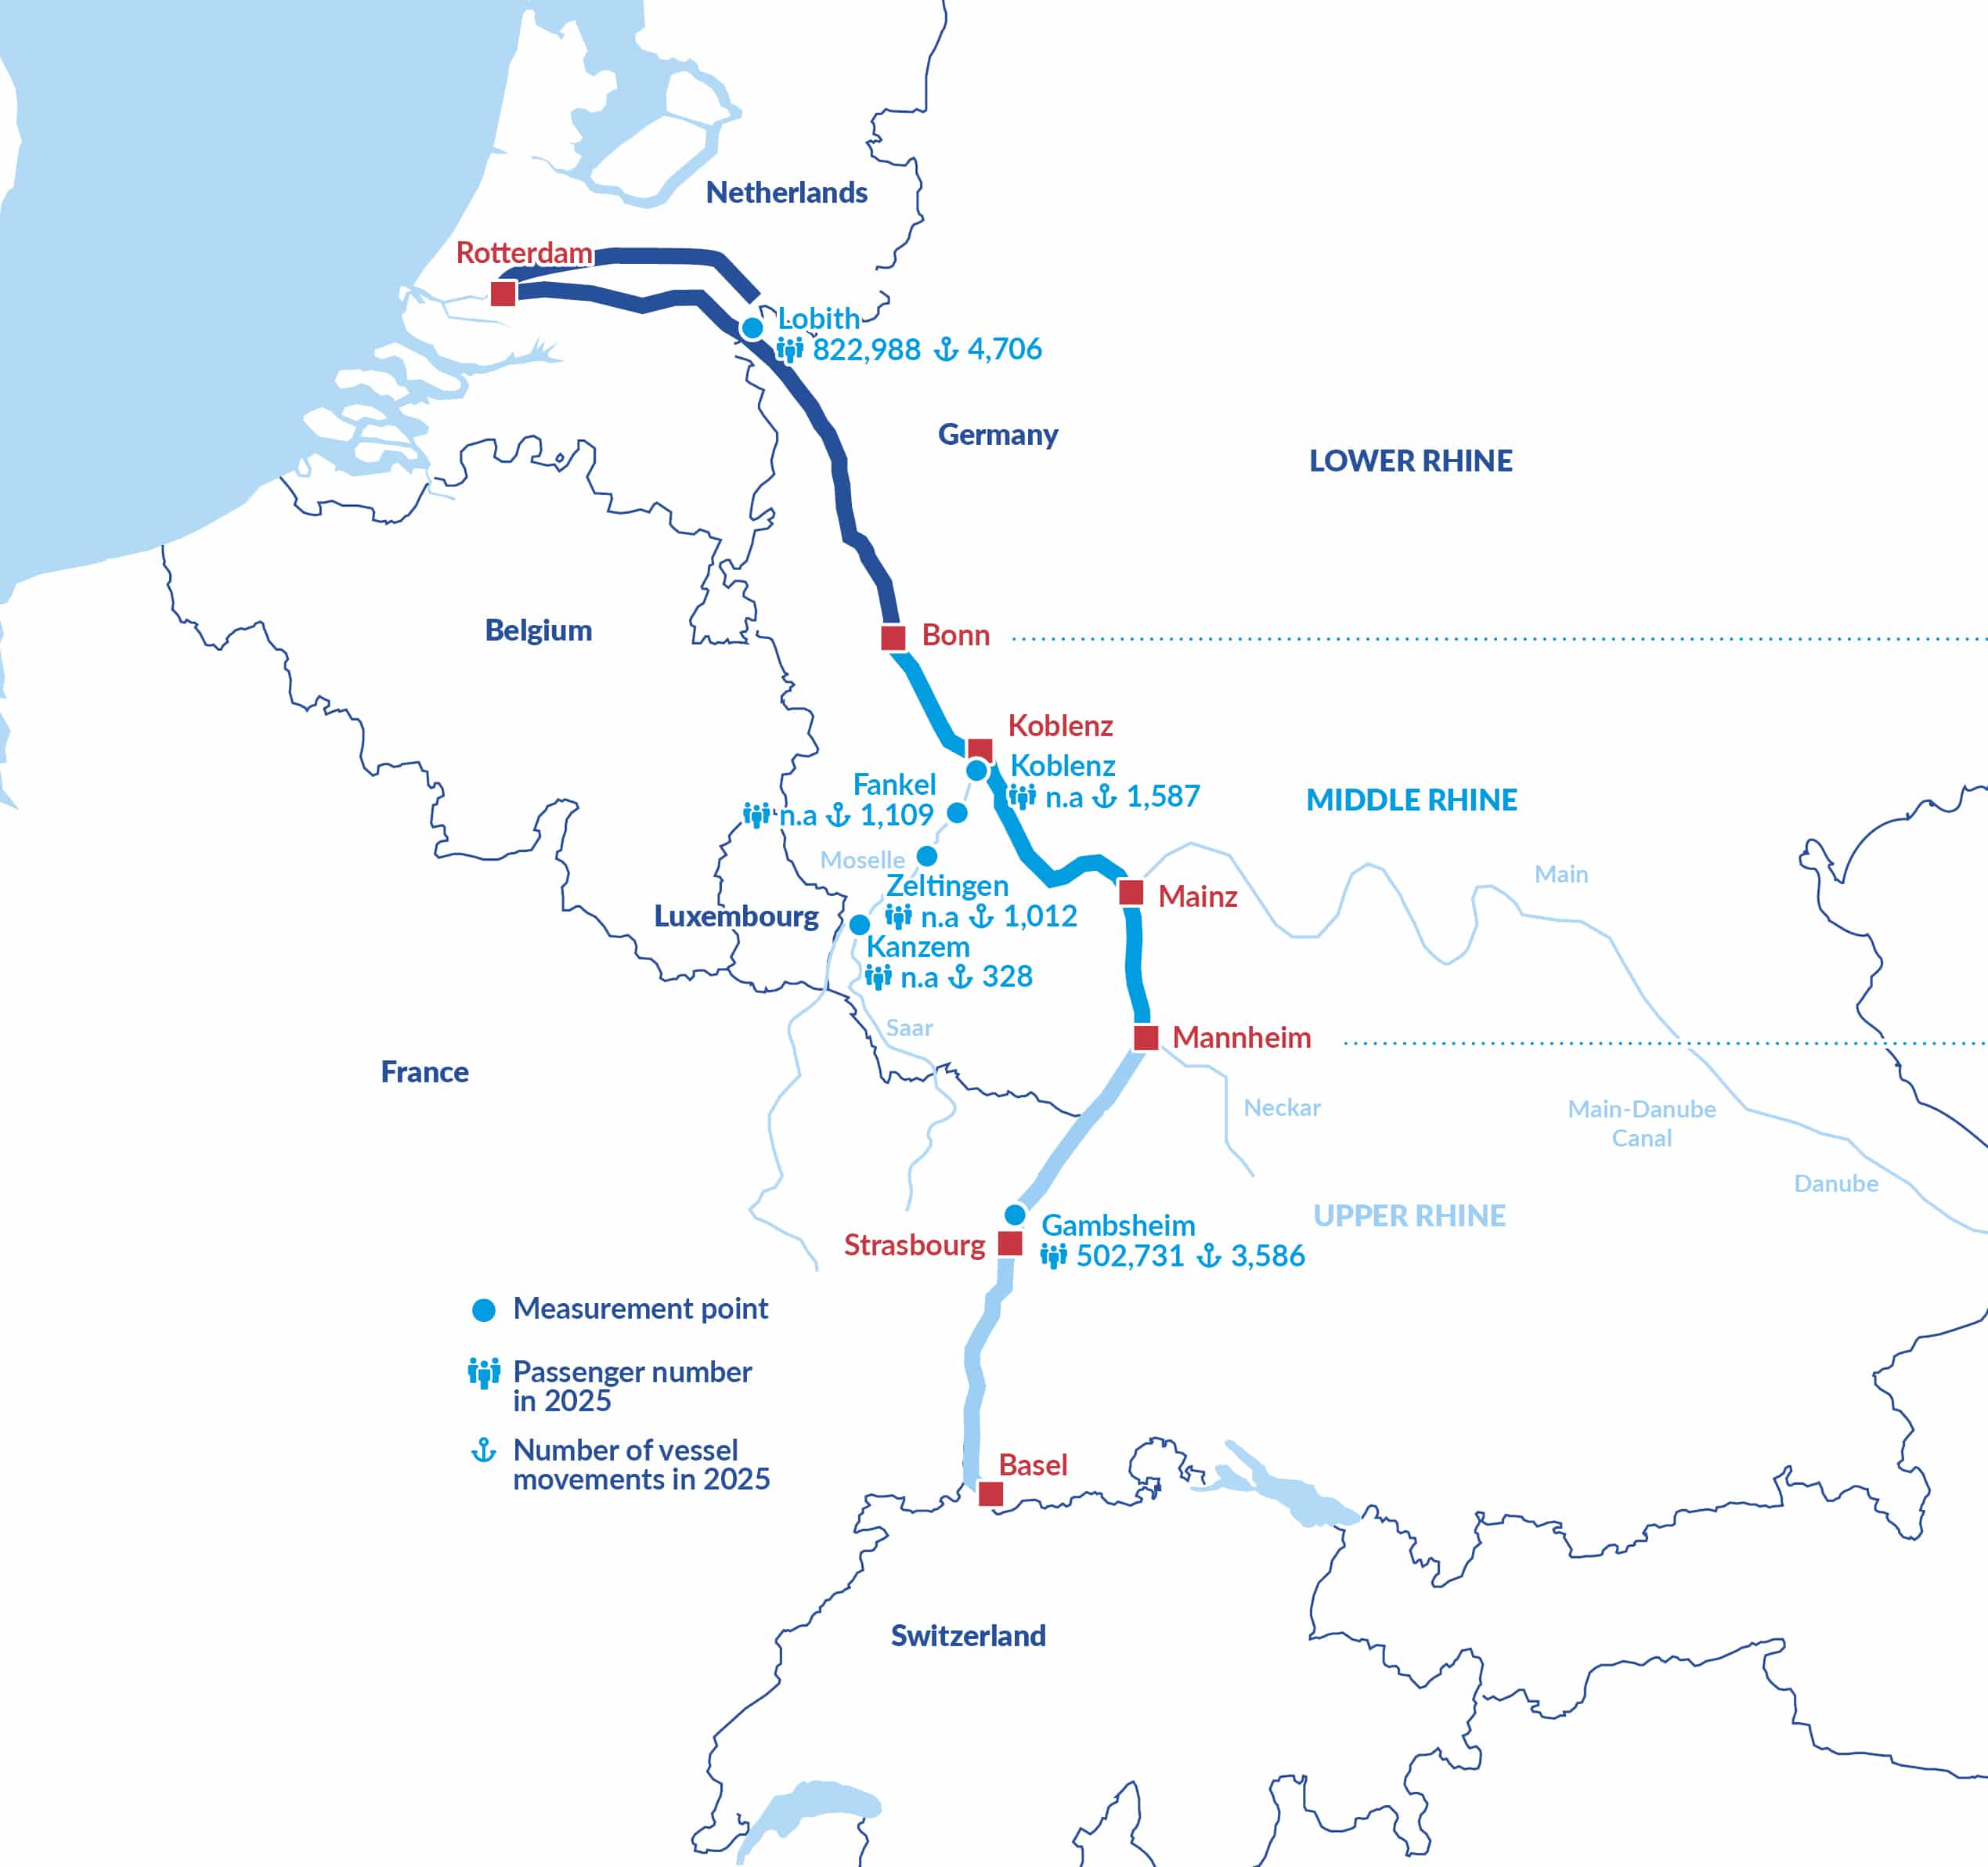
- In this annual report, two additional data sources for river cruises on the Rhine have been integrated. The first new source is the Waterway and Shipping Administration in the Netherlands (Rijkswaterstaat) which registers river cruises at the Dutch-German border near Lobith. According to this new source, the annual figures for the Rhine are higher than those published previously. The only source in the earlier annual reports (German Waterway and Shipping Administration) measured cruise traffic at Iffezheim on the upper Rhine.
- On the upper Rhine, the traffic is lower than on the lower Rhine, since many cruise vessels which come from Amsterdam turn off the middle Rhine into the Main and head towards the Danube. The second new source is the Waterway and Shipping Administration in France (Voies Navigables de France), which registers river cruise traffic at the lock of Gambsheim on the upper Rhine and which forms the border with Germany in this area.
- With 4,706 cruise vessels passing Lobith on the lower Rhine in 2025, the result was almost identical to the year 2024 (+0.3%). The number of passengers at this Dutch-German border point amounted to almost 823,000 (+2.1% compared to 2024). At Iffezheim on the upper Rhine, 3,340 cruise vessels were counted (+3.9%). The number of passengers at Gambsheim on the upper Rhine almost reached 503,000 in 2025 (+9.8%).
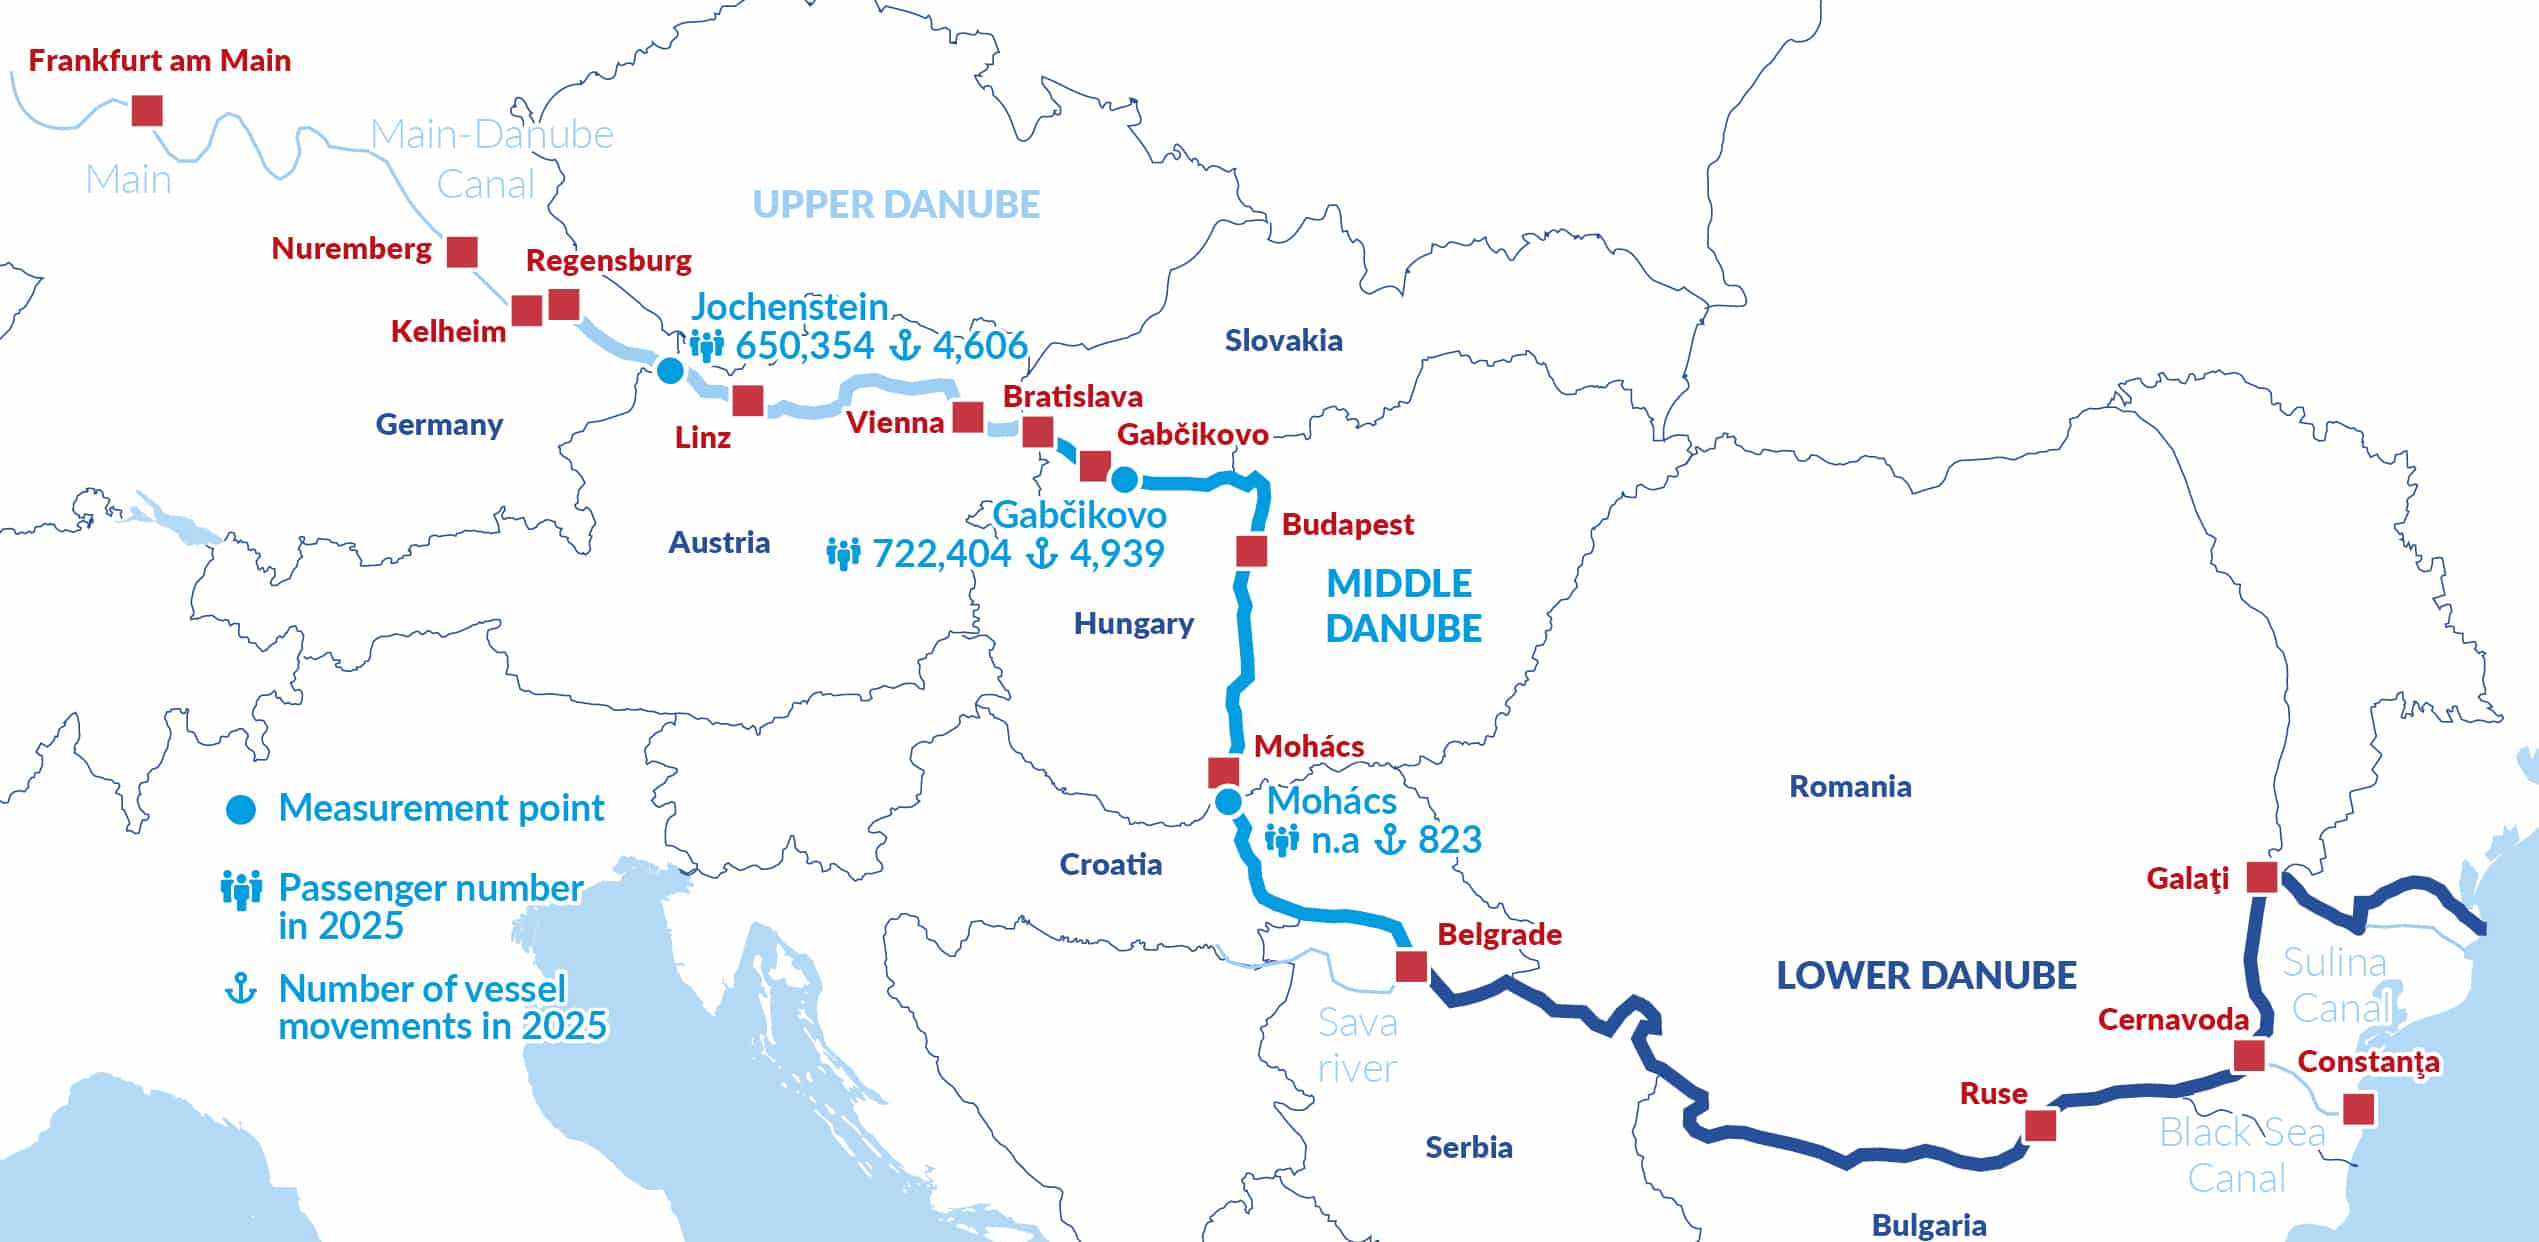
- With 4,939 cruise vessels passing the lock of Gabčikovo at the border between Slovakia and Hungary, the result of river cruise vessel movements was +15.7% higher than in 2024, while the number of passengers at this border point was -4.5% lower than in 2024.
- At the other measurement point, the German-Austrian border point of Jochenstein, the number of vessel movements was 4,606 in 2025, a strong increase of +28.1% compared to the previous year. The number of passengers amounted to 650,354 in Jochenstein near Passau (+35.9%). This exceptional boom was also influenced by a relocation of the starting point of cruise vessels from Engelhartszell (downstream of Jochenstein) to Passau (upstream of Jochenstein).
- The following three graphs summarise the development of river cruise vessel movements on the Rhine, Danube and Moselle since 2002/2004. The Rhine figures are taken from the German-Dutch border and the Danube is shown at the border point between Germany and Austria. It should be noted that the number of vessel movements on the Danube is higher at Gabčíkovo (Slovakian-Hungarian border with 4,939 river cruise vessels in 2025), but the data available for this point are only available from 2013.
- The capacity utilisation rate of the river cruise vessels is also a key indicator in assessing the development of the river cruise sector as it points to the profitability of operations. The degree of capacity utilisation of river cruise vessels can only be calculated for the upper Danube, as detailed data are needed for the number of passengers and the capacity of the vessels in terms of passenger places. The data are provided by WSV for the lock of Jochenstein (German-Austrian border).
- The capacity utilisation is defined as the ratio of the number of passengers divided by passenger capacity of the vessels that passed through the lock. It is calculated as the annual average of monthly utilisation rates in percentage points.
- The average capacity utilisation dropped from 64.0% in 2019 to 20.6% in 2020 due to the Covid pandemic. It took four years until 2024 to again reach a similar value to that of 2019 with 66.5% capacity utilisation. Since 2019 the highest level was reached in 2025 with a 74.0% capacity utilisation.
- Most passenger traffic in the Sava and Kupa river ports is concentrated at the Port of Belgrade in Serbia. Since 2015, river cruise passenger numbers at the Belgrade passenger terminal have increased steadily, from 60,000 in 2015 to 104,000 in 2019, reflecting the broader growth of Danube cruising. Most vessels calling at Belgrade operate along the Danube and include major eastern European capitals in their itineraries.
- As in other regions, passenger traffic was heavily affected by the Covid-19 pandemic, dropping to just 561 passengers in 2020. Since then, traffic has steadily recovered, reaching 81,649 passengers in 2025. While still below the 2019 peak, this level exceeds pre-2019 figures and confirms a positive recovery trend.43
FLEET FOR RIVER CRUISES36
FIGURE 1: NUMBER OF ACTIVE RIVER CRUISE VESSELS IN THE EU BY REGION OF OPERATION (2004 – 2026) *
ch6_fig1_raw data
Source: Hader A., The River Cruise Fleet Handbook (April 2026)
* 2026: based on order books as of April 2026.
FIGURE 2: NEW RIVER CRUISE VESSELS FOR THE EUROPEAN MARKET (2004-2027) *
ch6_fig2_raw data
Source: Hader A., The River Cruise Fleet Handbook (April 2026)
*2026 and 2027: based on order books as of April 2026.
FIGURE 3: NEW CRUISE CAPACITIES FROM 2020 TO 2026 PER REGION OF OPERATION (NUMBER OF BEDS) *
ch6_fig3_raw data
Source: Hader A., The River Cruise Fleet Handbook (April 2026)
*R-M-D= Rhine/Main/Main-Danube Canal/Danube. 2026: based on order books as of April 2026.
FIGURE 4: AVERAGE NUMBER OF BEDS IN NEW RIVER CRUISE VESSELS IN EUROPE BY YEAR OF CONSTRUCTION *
ch6_fig4_raw data
Source: Hader A., The River Cruise Fleet Handbook (April 2026)
*Figure for 2026: based on order books as of April 2026.
RIVER CRUISE DEMAND
-
River cruise tourism in Europe4041
Passenger numbers by rivers
Rhine
FIGURE 5: YEARLY NUMBER OF PASSENGERS ON RIVER CRUISE VESSELS ON THE RHINE
ch6_fig5_raw data
Sources: Rijkswaterstaat, VNF
* Lower Rhine = Dutch-German border (Lobith)
Upper Rhine = French-German border (Gambsheim)
Danube
FIGURE 6: YEARLY NUMBER OF PASSENGERS ON RIVER CRUISE VESSELS ON THE DANUBE
ch6_fig6_raw data
Sources: Danube Commission, WSV
* Gabčikovo = border Slovakia/Hungary; Jochenstein = border Germany/Austria
Number of vessel movements
FIGURES 7, 8 AND 9: YEARLY NUMBER OF CRUISE VESSEL TRANSITS ON RHINE, DANUBE AND MOSELLE *
ch6_fig7_raw data
ch6_fig8_raw data
ch6_fig9_raw data
Sources: Rijkswaterstaat, WSV and Moselle Commission
* Rhine = Dutch-German border (Lobith)
Danube = upper Danube, Austrian-German border (lock of Jochenstein)
Moselle = lock of Koblenz
Capacity utilisation
TABLE 1: CAPACITY UTILISATION OF RIVER CRUISE VESSELS PASSING THE GERMAN-AUSTRIAN BORDER ON THE DANUBE
| Year | Degree of capacity utilization of the river cruise vessels |
|---|---|
| 2019 | 64.0% |
| 2020 | 20.6% |
| 2021 | 27.3% |
| 2022 | 54.6% |
| 2023 | 55.1% |
| 2024 | 66.5% |
| 2025 | 74.0% |
Sources: CCNR analysis based on data provided by WSV
Sava river
DAY TRIP FLEET AND DEMAND
- Day trip passenger fleet and demand data are not consistently available across European countries, and the level of detail varies significantly depending on national statistical systems. Based on the information that is available, the following overview can be provided for 2024. Detailed data per country are also available on the market observation website.
DAY TRIP FLEET
TABLE 2: NUMBER OF DAY TRIP VESSELS BY COUNTRY IN 2024
| Country | 2024 | Notes |
|---|---|---|
| Rhine countries | ||
| Germany | 1.093 | Including 808 on rivers and canals, 124 on lakes and 161 small harbour boats |
| The Netherlands | 529 | Including 71 passenger ferries and 192 certified sailing historic passenger ships for the transport of more than 12 people (so called “Bruine vloot” – Brown fleet).47 |
| France | 322 | |
| Switzerland | 140 | |
| Belgium | 59* | *Data refers to 2023. Including 3 passenger ferries |
| Danube countries | ||
| Romania | 323* | *Data refer to 2023 |
| Hungary | 137 | |
| Austria | 31* | *Data refer to 2023 |
| Slovakia | 13 | |
| Other countries | ||
| Italy | 276* | *Data refer to 2023 |
| Poland | 109 | |
| Czech Republic | 92 | |
Sources: VNF, WSV, IVR, Federal Swiss Office of Statistics, Danube Commission, Statistical Office of the Slovak Republic, Ministry of Transport of the Czech Republic, Italian Ministry of Transport, Statistics Poland
DAY TRIP DEMAND
TABLE 3: NUMBER OF PASSENGERS (IN MILLIONS) ON DAY TRIP VESSELS BY COUNTRY IN 2024
| Country | 2024 (in million passengers) | Notes |
|---|---|---|
| Rhine countries | ||
| France | 9.2 | |
| The Netherlands (Amsterdam) | Approx. 3 per year | No annual breakdown available |
| Switzerland | 13.7 | Includes the Swiss lakes. Activity measured in vessel-km was approx. 2.2M km in 2024) |
| Danube countries | ||
| Hungary | 2 | Including Danube and Lake Balaton |
| Austria | 0.6 | |
| Slovakia | 0.07 | |
| Other countries | ||
| Italy | 103.3 | Data refer to 2023. Including Venetian Lagoon (88%) + Italian lakes (12%) + River Po (<0.1%) |
| Poland | 1.1 | |
Sources: VNF, City of Amsterdam, Federal Swiss Office of Statistics, Danube Commission, Statistical Office of the Slovak Republic, Italian Ministry of Sustainable Infrastructure and Mobility, Statistics Poland
AGE STRUCTURE OF THE RHINE PASSENGER FLEET
- Concerning the passenger fleet, it is divided into passenger ferries, river cruise vessels, and passenger day-trip vessels. The figure below depicts the current fleet and its evolution over time. However, it is worth noting that inactive vessels may be included in these figures, and some of the newest vessels may not be accounted for. Most passenger ferries and day-trip vessels (which represent 69% of all passenger vessels on the Rhine) were constructed in the 20th century (with peaks in the 1960s and 1990s), but there has nevertheless been significant newbuilding activity in the 21st century. The number of day-trip newbuildings in Rhine countries has been following a decreasing trend since 2000, while the number of new ferries has grown over the past two decades.
- The number of passenger vessels on the Danube peaked in 1980 (162 ships) and increased steadily between 2000 and 2017. However, the capacity of the Danube passenger fleet in the 21st century has still not reached the pre-1990s levels.45
FIGURE 10: COMMISSIONING YEARS FOR THE RHINE PASSENGER FLEET OVER TIME (NUMBER OF INLAND VESSELS)
ch6_fig10_raw data
Sources: IVR and CCNR analysis, Bačkalov I. et al., Evolution(s) of European Inland Vessel Fleets (2025).
Note that one river cruise vessel and six day-trip vessels have an unknown year of construction. The database of IVR accounts for active vessels but also includes some inactive vessels, in particular those commissioned in earlier years.