


• Navigation conditions on the Rhine in 2025 were less favourable than in 2024, with more periods of restricted available draught, particularly during the spring. Nevertheless, water levels remained better than during the severe low-water years of 2018 and 2022. On a regional level, the conditions were especially difficult at the upper Rhine (Basel and Maxau). On all the Danube stretches, there were significantly more low water days in 2025.
• Nominal freight rates increased in response to lower water levels, higher operational constraints and cost pressures. Still, the estimation of a cost index for Rhine navigation shows an increase of +88% of total costs in tanker barging since 2004. There was an acceleration of this cost increase since 2020. Therefore, on average, the real revenue from IWT has either stagnated (in tanker barging) or declined (in dry cargo transport).
• Adjusting the long run freight rate increase for rising costs shows that the rise in nominal freight rates disappears, indicating that real income evolution in Rhine navigation was characterised by very weak profit margins.
WATER LEVELS, AVAILABLE DRAUGHTS AND NAVIGATION CONDITIONS
- The overall performance of inland waterway transport is linked to – among other factors – water levels, which determine the amount of cargo that a vessel can load and transport under safe navigation conditions. High water depths and the resulting high load factors lead to lower fuel consumption per unit of output. Indeed, the more water there is under the keel, the lower the required power and the lower the fuel consumption. Indeed, the more water there is under the keel, the lower the required power and the lower the fuel consumption. The less water there is under the keel, the faster the required power and the higher the fuel consumption.
- Although the reduction of the load factor during a low water period could be compensated by putting more vessels into operation, there are obvious limitations to this.11 In addition, other reasons besides vessel availability play an important role. For instance, higher costs during such periods lead to some operators delaying the transport of some of their cargo, especially the less urgent or less profitable ones. In addition, some clients also look for other modal alternatives where available. An example is the low water period experienced in both autumn 2018 and summer 2022 on the Rhine. These two periods inflicted a reduction of the entire cargo transport. Hence, the lower load factors per vessel could not be compensated by putting more vessels into operation.
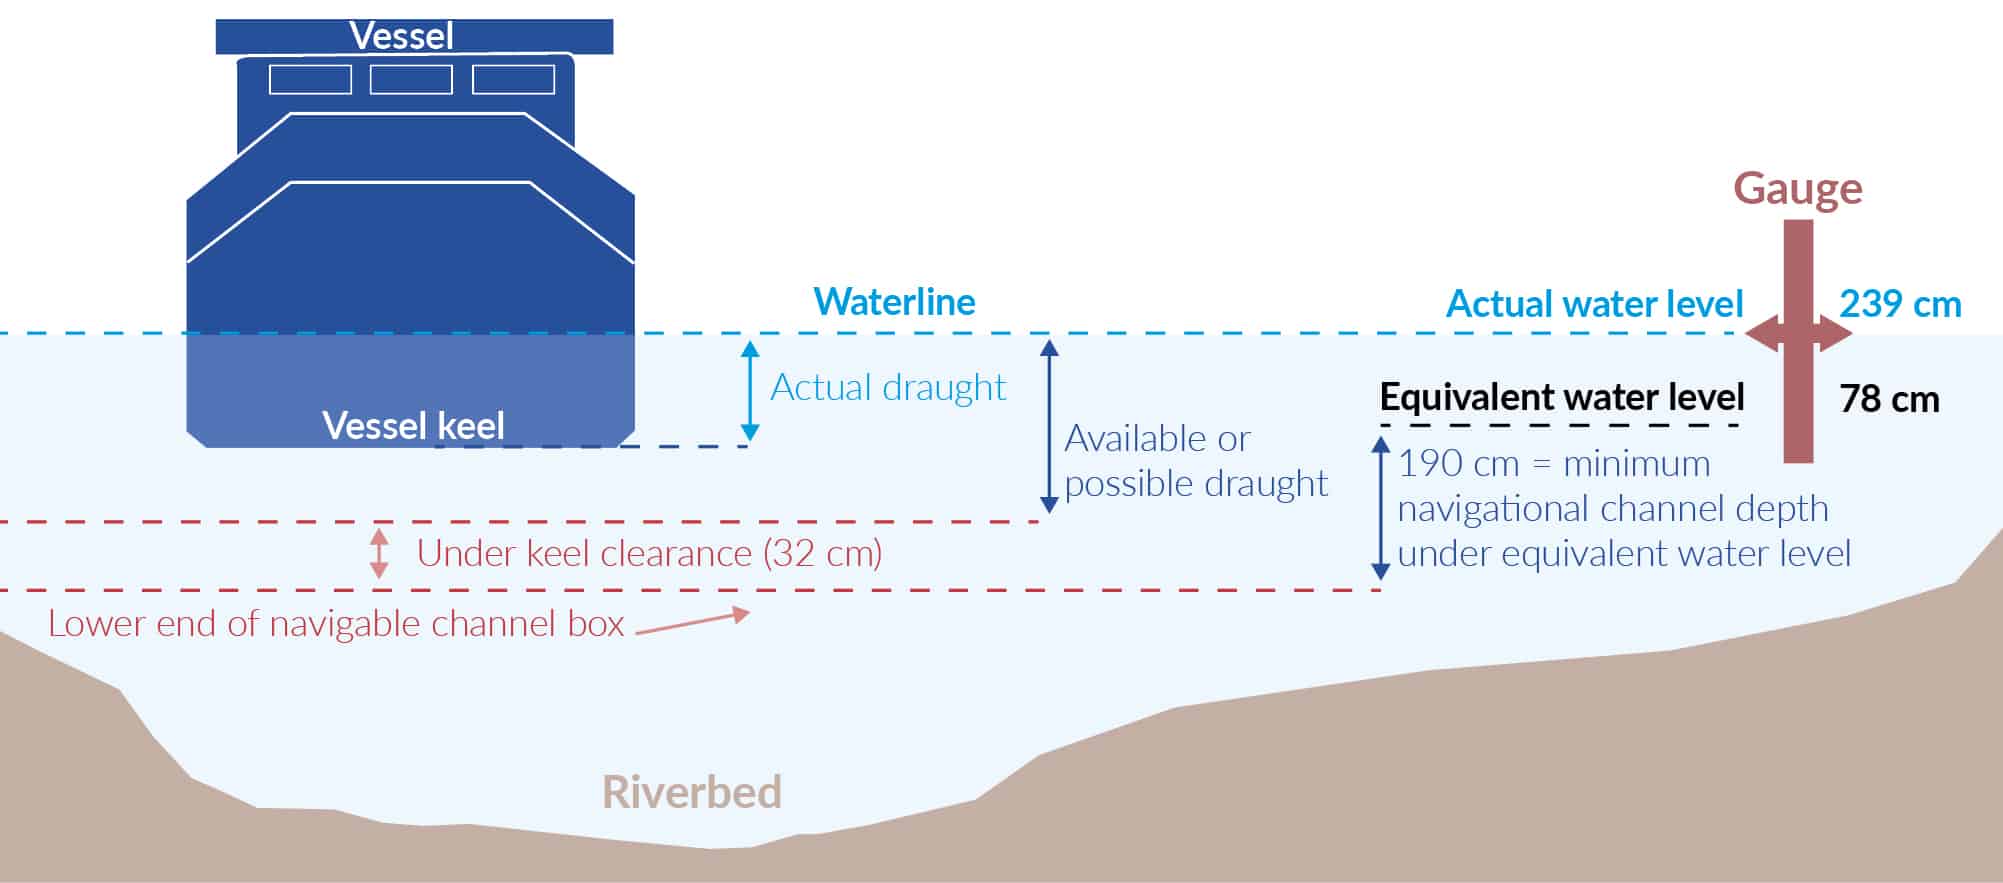
- The amount of cargo that a vessel can load at a certain water level is determined by the available draught, as can be seen in the next figure.
- One way of observing hydraulicity and navigating conditions is to calculate available draught figures based on water levels. The available draught is the depth by which a vessel can sink into the water under safe conditions. This depth is calculated based on water levels and parameters such as the equivalent water level and the minimum navigational channel depth.12
- The following figure shows the number of days during which a certain available draught was present for the gauge station of Kaub. It shows that the year 2025 was characterised by navigating conditions that were less favourable than in 2024. For example, on 18 days of the year, the available draught was between 1.31 m and 1.80 m at Kaub, compared to 0 days in 2024. In 2018, this category counted 84 days, 52 days in 2022 and 24 days in 2023. However, unlike the year 2018 and 2022, the available draught never dropped below the value of 1.31 m at Kaub in 2025.
- The year 2024 had been a year with some high water which was not the case in 2025.
FIGURE 1: ACTUAL WATER LEVEL, ACTUAL DRAUGHT, EQUIVALENT WATER LEVEL, MINIMUM NAVIGATION CHANNEL DEPTH AND POSSIBLE OR AVAILABLE DRAUGHT AT KAUB/MIDDLE RHINE *
Sources: CCNR based on BfG (2015)
* The distances in this drawing are not at scale. In this illustration, the date chosen to determine the available or possible draught is 3 September 2020, when the actual water level was 239 cm on average. For a sailing vessel, the actual draught also contains the squat effect. The latter results from hydrodynamic effects and leads to a higher draught compared to a vessel at rest. The squat effect is stronger the less water present under the keel, and the faster the vessel is sailing.
FIGURE 2: NUMBER OF DAYS PER YEAR FOR AVAILABLE DRAUGHT INTERVALS AT KAUB
ch3_fig2_raw data
Sources: CCNR calculation based on data from WSV, provided by BfG
NUMBER OF CRITICAL LOW WATER DAYS FOR RHINE AND DANUBE GAUGE STATIONS
- Another method for assessing the quality of navigating conditions over an entire year is based on the concept of counting the number of days when water levels are below a certain reference low water level, known as Equivalent Water Level (EWL) for the free-flowing sections of the Rhine and Low Navigable Water Level (LNWL) for the Danube. If water levels drop below this reference low-water level, this indicates a critically low navigation situation.
- The EWL is determined by the CCNR for several gauge stations along the Rhine. The values are adapted every ten years, to take account of natural and anthropogenic changes.
- The equivalent water level 2012 came into force in 2014 and remained valid until the end of 2022. A new equivalent water level was introduced on 1 January 2023 (known as EWL 2022) and will be applicable until the end of 2031.
- Although the equivalent water level is measured in centimetres, the starting point of its determination is a flow concept. Indeed, equivalent flow values (indicated in the unit m3/s) measured against the benchmark levels are recalculated every ten years as flows within a 100-year time series. The equivalent flow values are then used to recalculate the corresponding equivalent water level (EWL) values against the benchmark levels every ten years. The EWL consequently includes the following definition: “The equivalent water level (EWL) is the water level occurring along the Rhine at an equivalent water flow falling below the long-term average for 20 days [per year] without ice”.
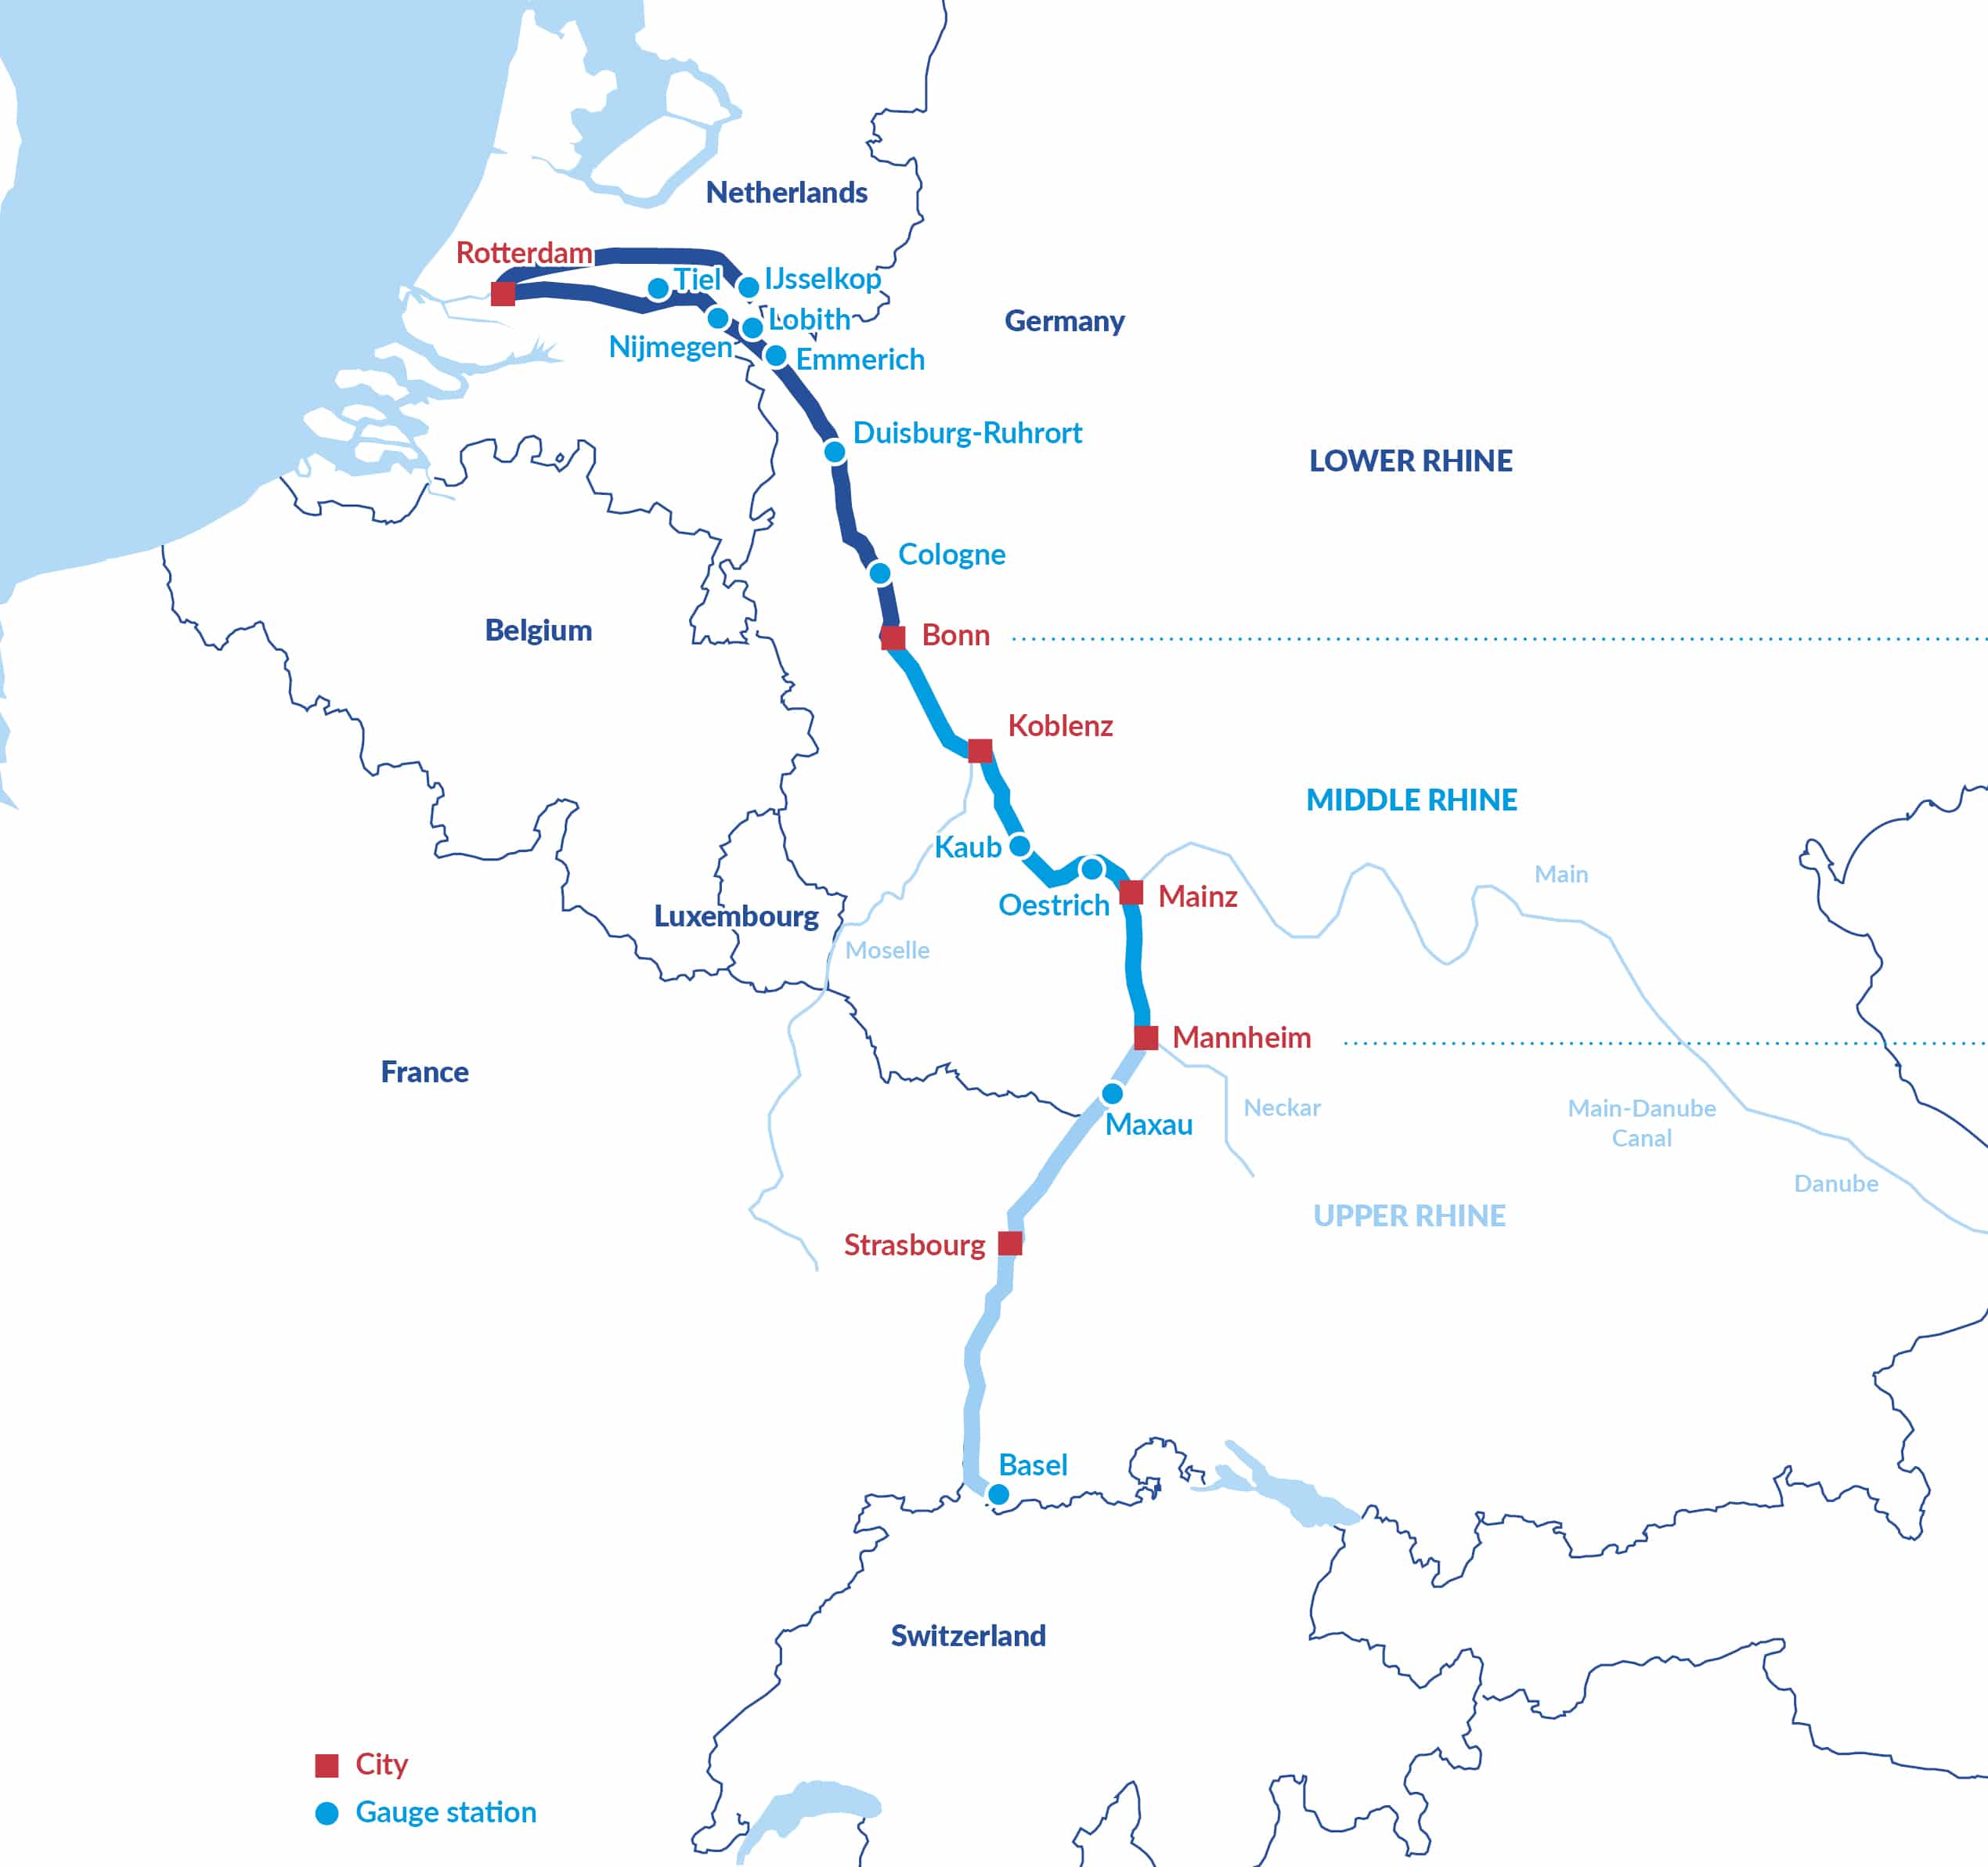
- For these 11 Rhine gauges, daily water level data were collected and analysed.
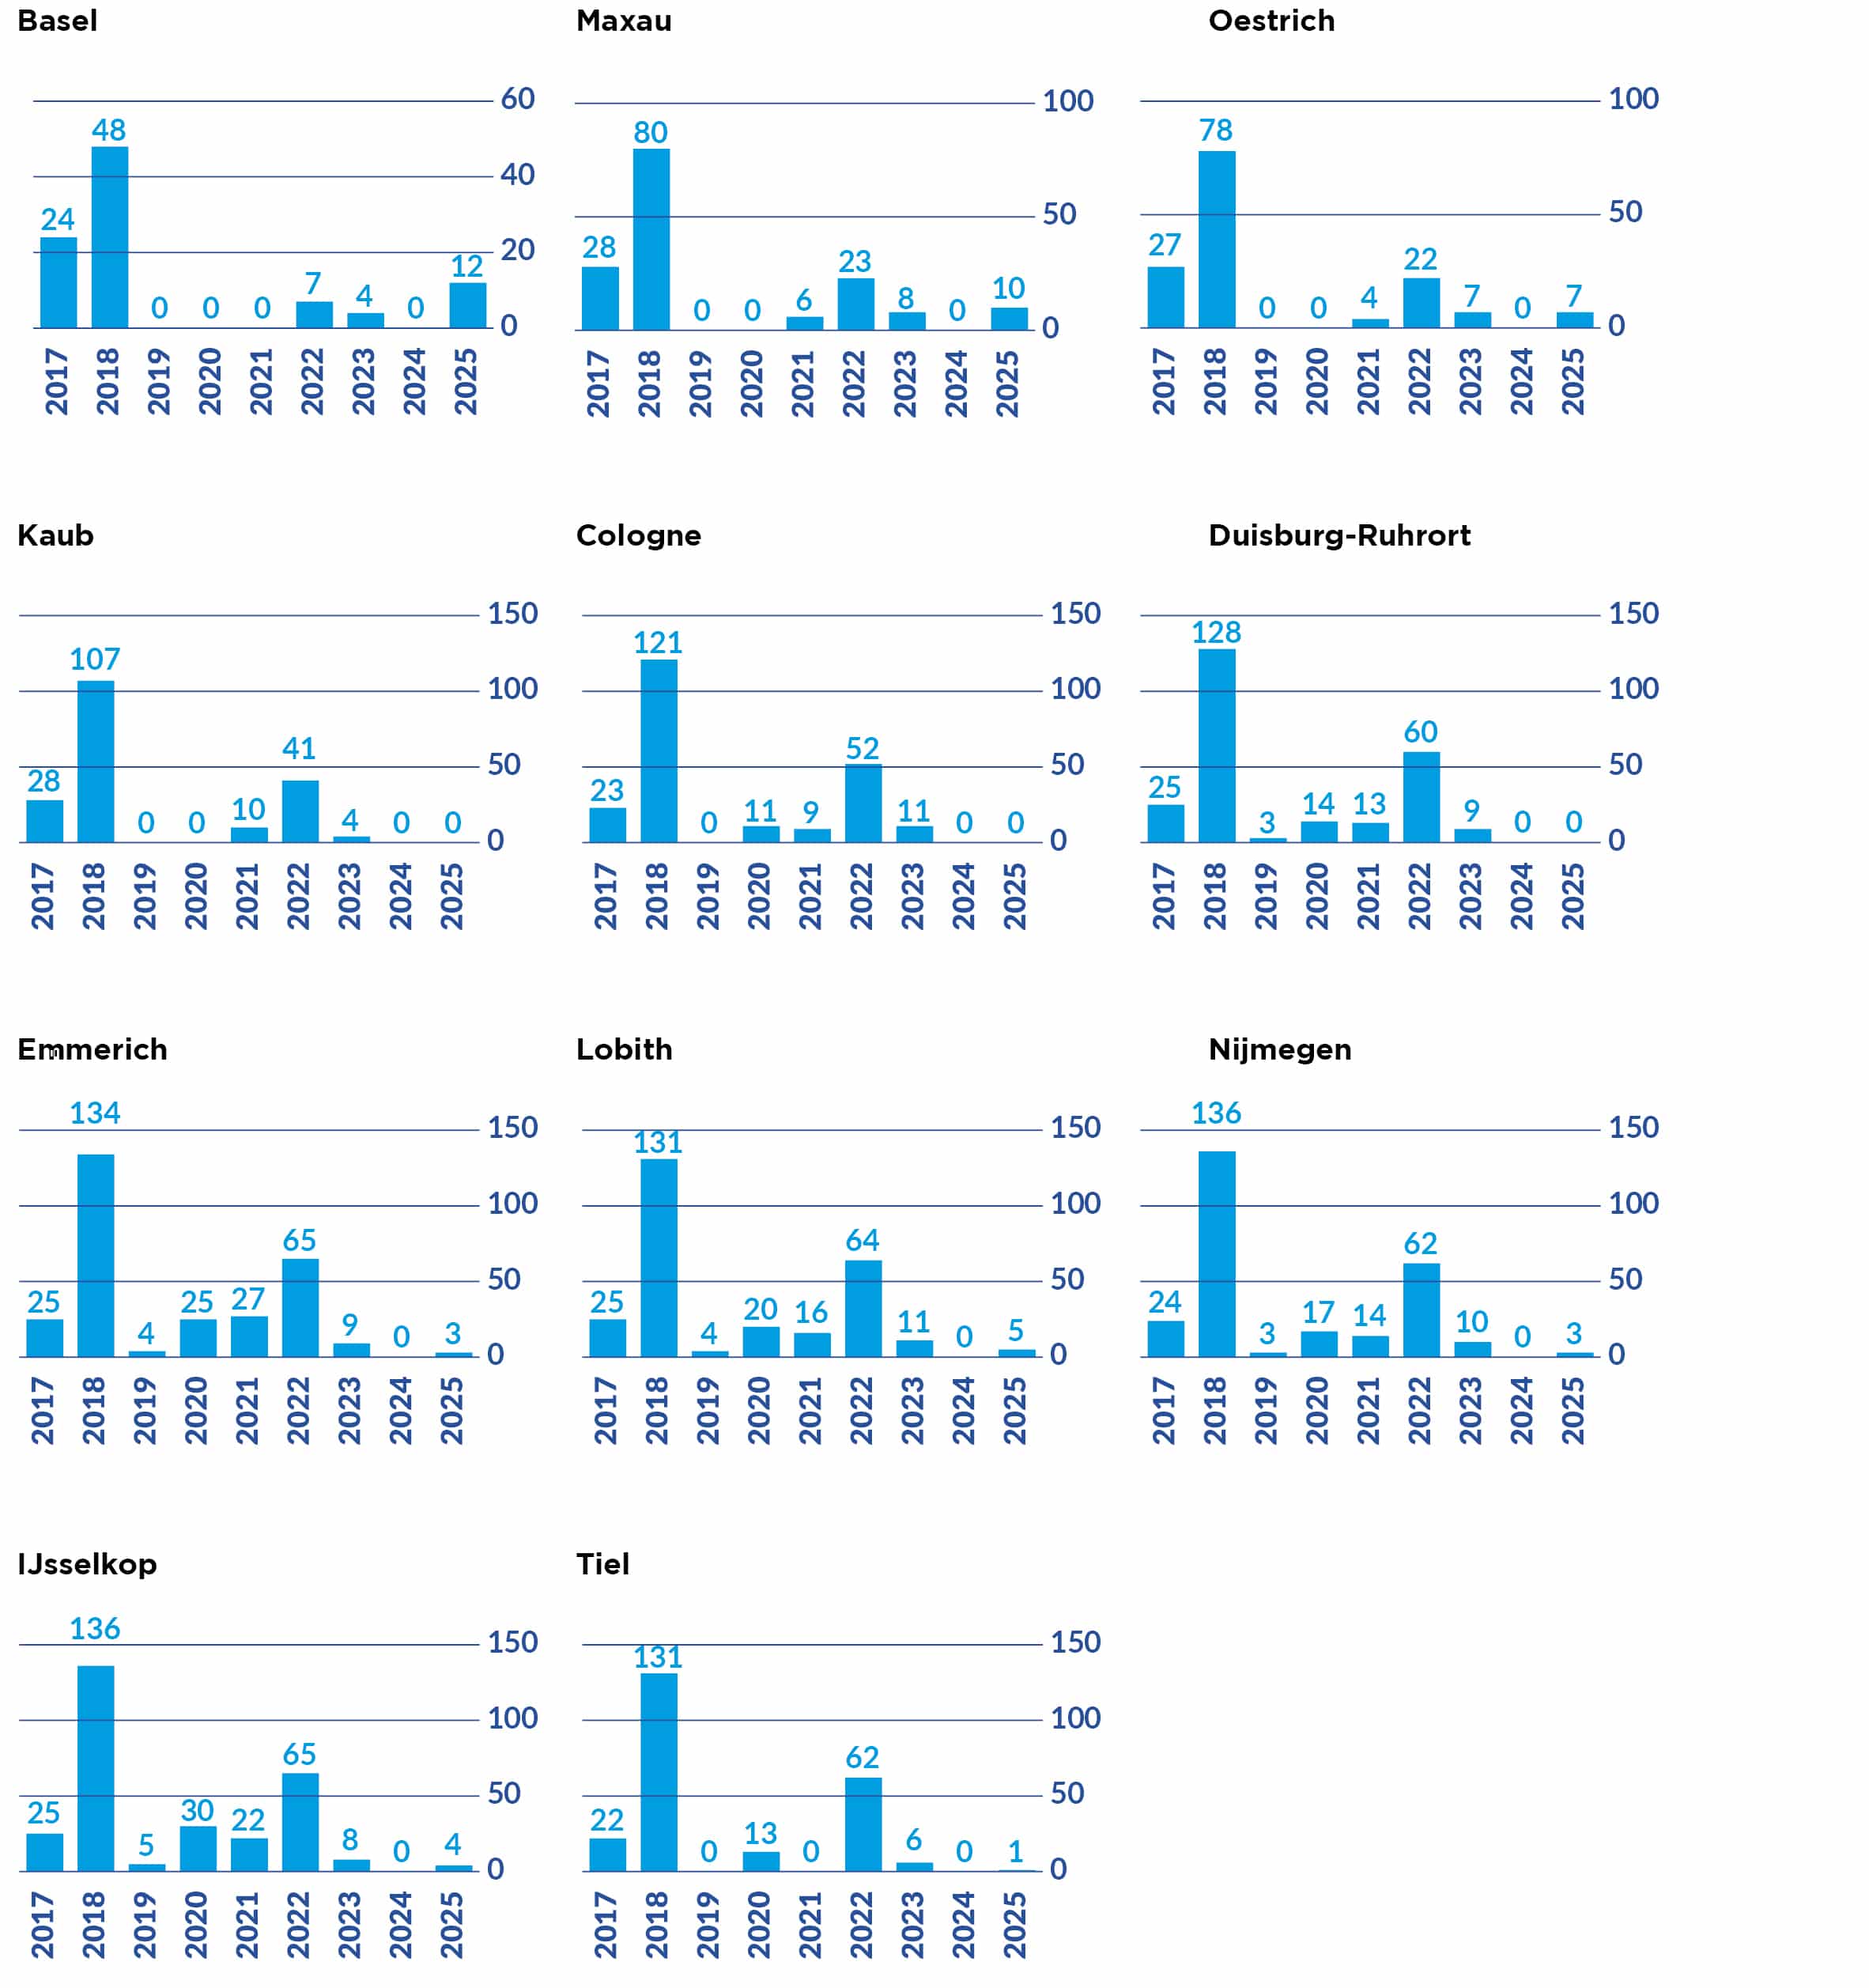
- The following figures show the number of days below the equivalent water level for the above-mentioned gauge stations.
- As the figures for the available draught for Kaub have already shown, there were temporary low water periods in 2025, in particular in the spring. Regionally, the conditions were especially difficult at the upper Rhine (Basel and Maxau) and at Oestrich on the middle Rhine. But there were slightly more low water days (days with water levels below the equivalent water level) also at the lower Rhine (Emmerich, Lobith, IJsselkop, Nijmegen) than in 2024.
- The continued efforts to strengthen the resilience and reliability of IWT to low water periods remain necessary. Indeed, under the influence of climate change, longer periods of drought and more extreme events are expected.
- The reference low water level of the Danube is known as ‘Low Navigable Water Level (LNWL)’. It is defined as the water level exceeded on 94.0% of days in a year (i.e. on 343 days) during ice-free periods over a reference of several decades.13
- Based on this definition, the number of days below the Low Navigable Water Level (LNWL) can be calculated for the Danube.
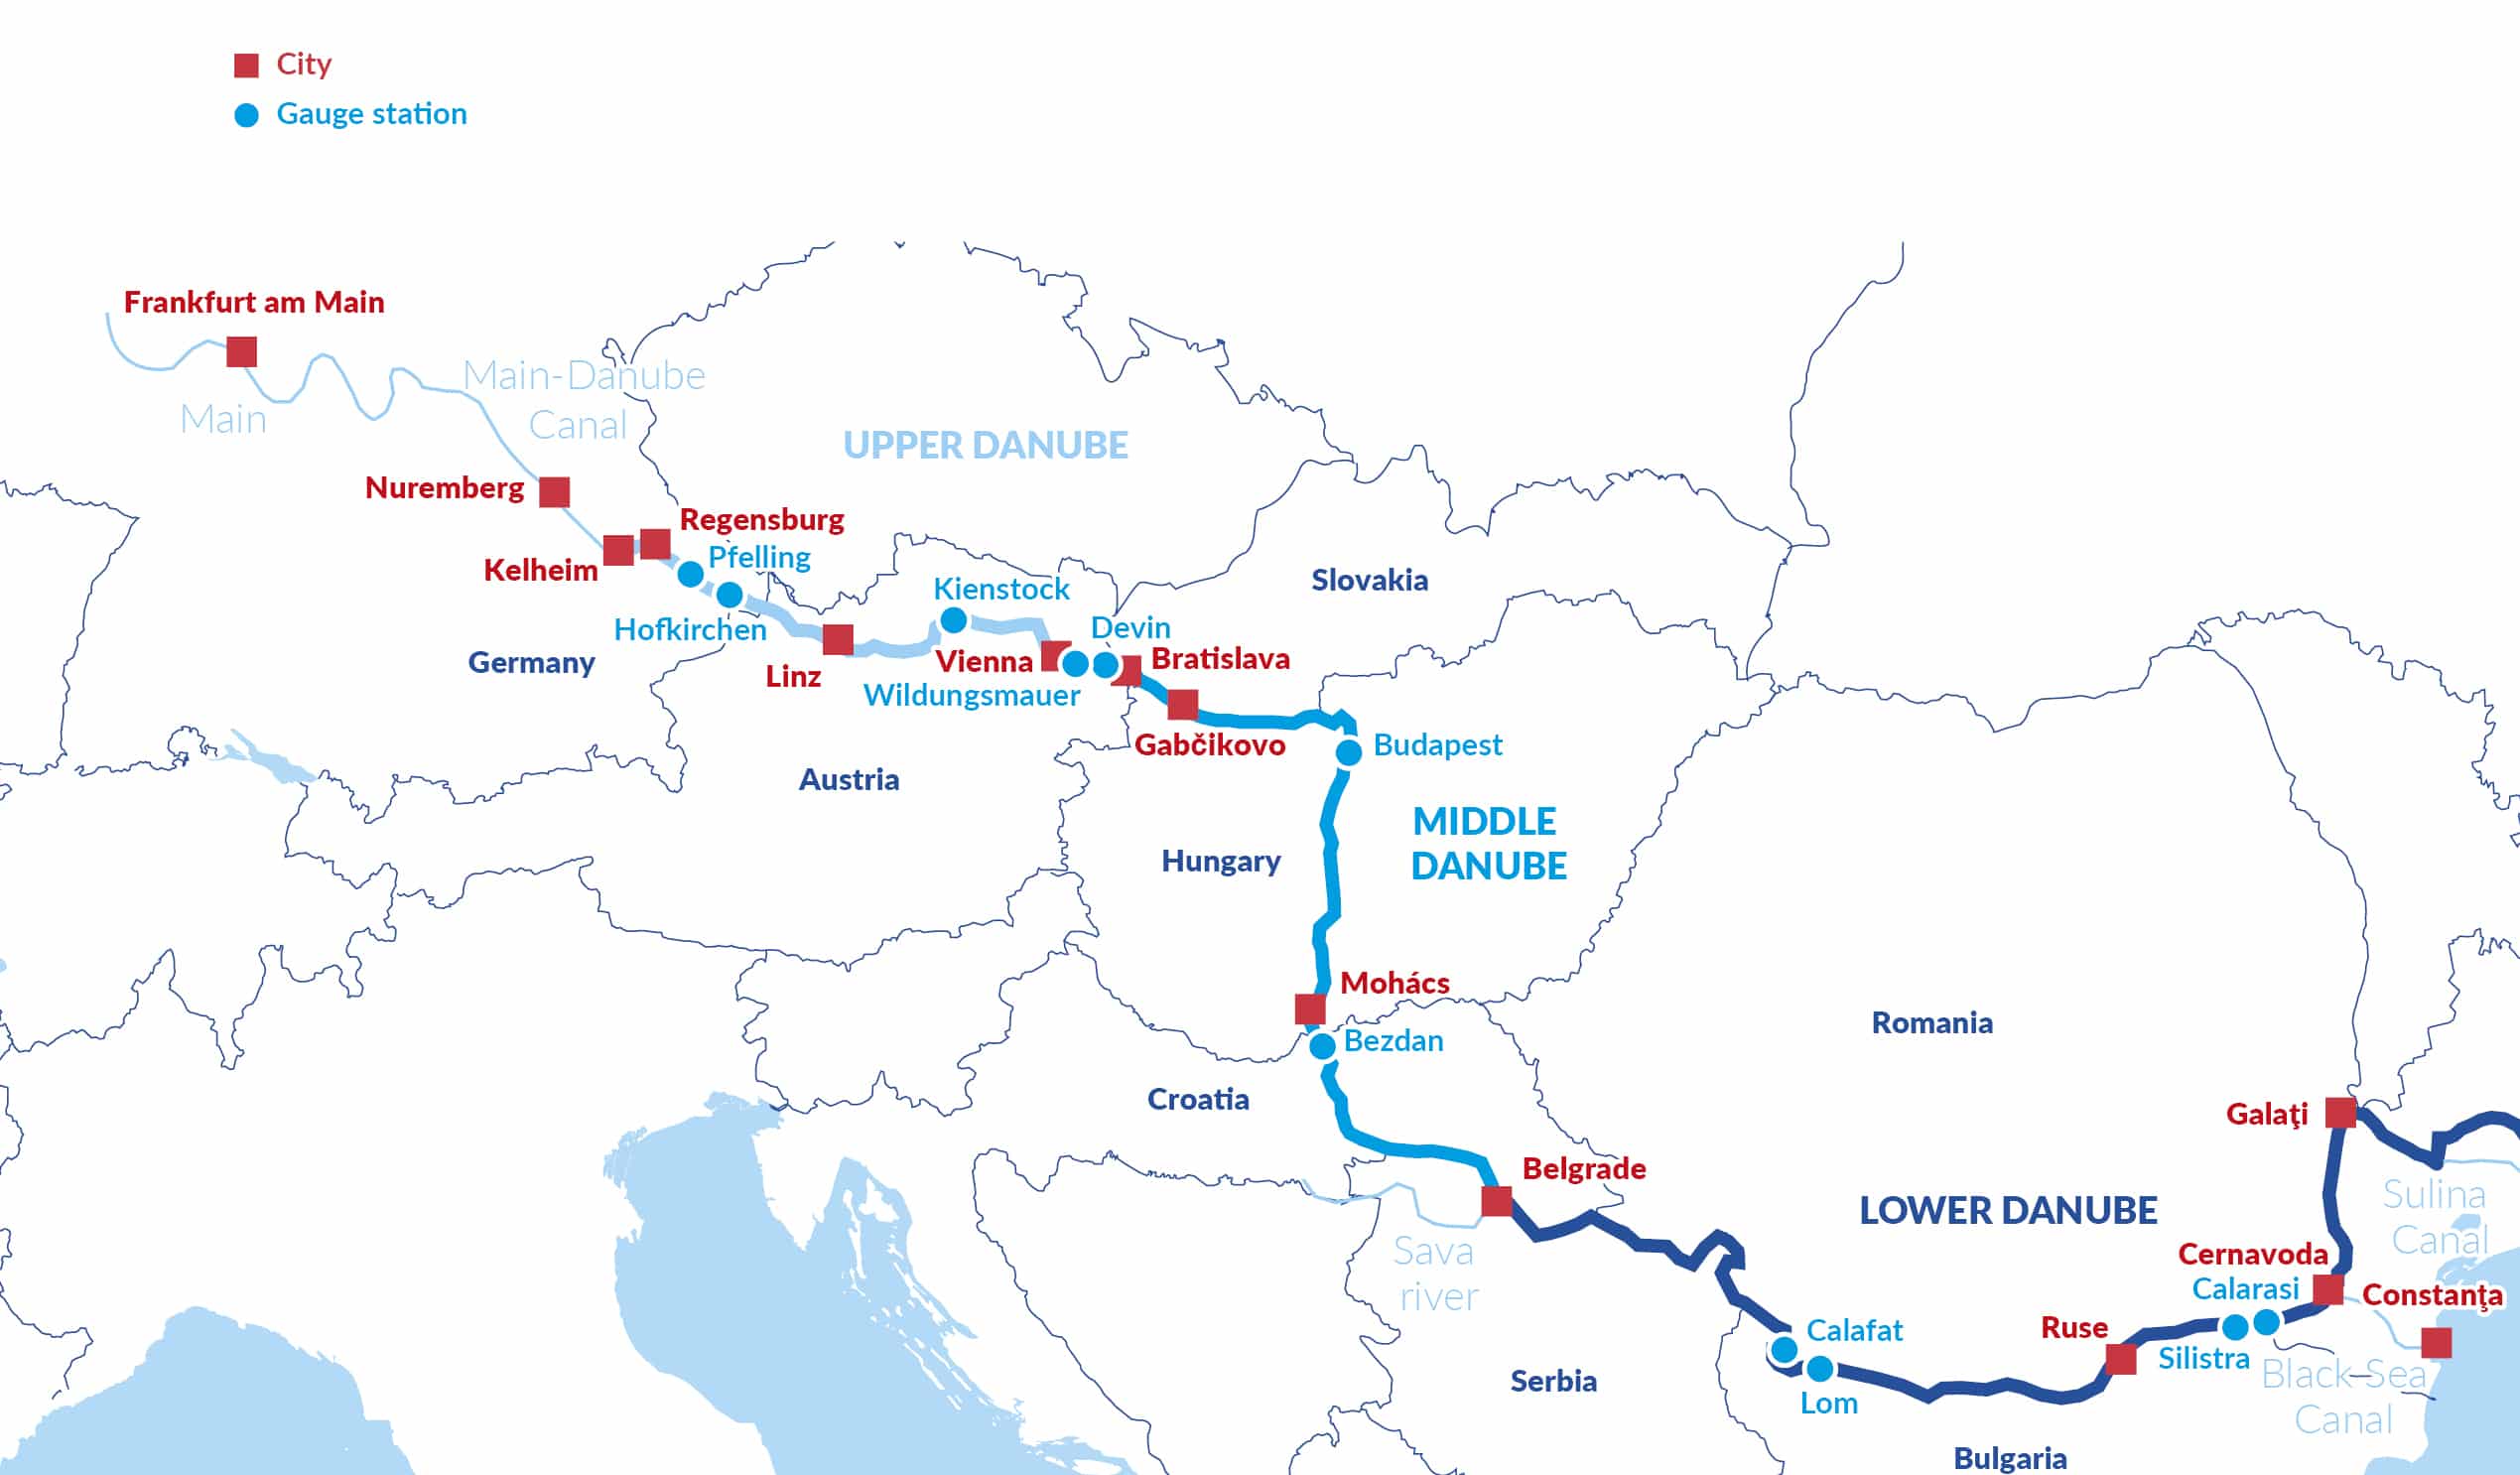
- For 11 important gauge stations on the Danube, daily water level data were collected and analysed by the Danube Commission. The figures below show the number of days per year on which the actual water levels fell below the Low Navigable Water Level.
- The data for the 11 Danube gauge stations indicate a serious deterioration of the quality of water level conditions in 2025 compared to previous years. This had a negative impact on cargo transport on the Danube in 2025.
- Figure 3 illustrates the liquid cargo spot market freight rate index for gasoil within ARA-Rhine transport of liquid bulk (yearly averages), not adjusted for inflation or cost increase. It follows a rising trend. In addition, the strong low water periods, which occurred in 2015, 2018 and 2022, are clearly visible as positive peaks. The observed trends are almost identical for the three different geographical entities shown – two stretches of the Rhine (lower Rhine, upper Rhine) and the Main affluent.
- But this overall rising trend largely reflects the effects of inflation or cost increase over time rather than improved market conditions.
- To ‘deflate’ the freight rate series, a cost index for tanker barging on the Rhine was estimated. For the cost index, it needs to be borne in mind that modern tankers (double-hull vessels) are more expensive than dry cargo vessels. This implies a higher share of capital costs. In addition, personnel costs are also higher in tanker shipping due to specialised crews.
- The following figure shows the combination of individual cost indices and their weight over time (called a combined cost index), as presented in table 3.
- The combined cost index confirms the steep cost increase since the Covid era, especially between the years 2020 and 2022. The reasons for the cost increase, driven in particular by fuel costs and repair and maintenance costs, are shown in the next table.
- The adjusted nominal freight rates data for the cost increase in figure 5 (obtained by dividing the nominal freight rates from figure 3 by the combined cost index in figure 4), provide a completely different picture.
- Overall, the analysis shows that the rising trend has virtually disappeared and has given way to a stagnating pattern over time, without a real rising or declining trend. In other words, the real price and real income from tanker barging have stagnated since 2004 and were only temporarily driven upwards by the effect of low waters in specific years, notably 2015, 2018 and 2022.
- Statistics Netherlands (CBS) collects freight rate data from a panel of Dutch IWT companies. The price levels are based on fixed routes for which questionnaires are sent out twice a quarter. They comprise the sailing costs including fuel and low water surcharges and exclude cargo handling costs. Overall, a gradual and steady increase is observed for nominal freight rates, which temporarily spiked in 2022/23 due to low water occurrence. Yet, these nominal rates are not corrected for the cost increase.
- In order to deflate these nominal freight rate data, a cost index needs to be established, as it was done for liquid bulk transport.
- Reasons for these different shares:
– The share of fuel costs in dry bulk IWT is higher than in liquid bulk transport and in container transport since the shares of capital and insurance costs are lower.
– The capital costs and their share for container and for tanker vessels are higher as they are more expensive than dry cargo vessels.
– The higher value of the cargo in liquid cargo and container transport increases the cargo-related insurance premiums and therefore the share of insurance costs compared to dry cargo vessels.
– The other costs component has a higher share in container transport as the container liner schedules require more logistical administration and back-up service. - The graph showing the combined cost index for both market segments looks almost exactly the same as the cost increase for liquid cargo transport. The entire cost increase in dry cargo transport was +86% since 2004 and +43% since 2020. For container transport, the cost increase amounted to +83% (since 2004) and to +39% since 2020.
- The adjustment of the nominal CBS freight rates for the cost increase is carried out by dividing the dry cargo rates by the dry cargo cost index (with base year 2021), and the container rates by the container cost index (with base year 2021). Likewise, the liquid cargo rates are divided by the liquid cargo cost index (with base year 2021).
- The analysis reveals that cost-adjusted freight rates for the dry cargo spot market averaged 11% below the 100-point baseline during 2024 and 2025. This indicates that freight rate growth lagged behind cost increases by an average of 11% in this sector. A similar, though less pronounced, trend was seen in dry cargo contract prices, where the rate increase was 6% less than the cost rise. In contrast, liquid cargo and container transport remained relatively balanced, with rate adjustments nearly offsetting cost increases (maintaining a marginal 1% gap). Overall, this result suggests a better income evolution in liquid cargo and container transport compared to dry cargo transport but does not indicate any significant profit margins in any of these market segments.
- For the liquid cargo transport within the extended ARA region, between Amsterdam, Antwerp, Flushing, Ghent, Rotterdam and Terneuzen, a dataset on spot market freight rates provided by the tanker barge cooperation CITBO14 was analysed. The shares of the different product groups within cargo transported were as follows:
– Gasoil and components: share of 63% in 2025, 37% in 2024 (41% in 2023 and 38% in 2022)
– Gasoline and components: share of 31% in 2025, 37% in 2024 (37% in 2023 and 29% in 2022)
– Biodiesel: share of 2% in 2025, 13% in 2024 (18% in 2023 and 26% in 2022)
– Chemicals: share of 1% in 2025, 4% in 2024 (2% in 2023 and 6% in 2022)
– Heavy products: share of 2% in 2025, 8% in 2024 (0.2% in 2023 and 1% in 2022). - The segment of gasoil and components is by far the most important segment regarding the absolute transport volume. The share of this segment has increased strongly in 2025. Gasoil is also the core segment within mineral oil products transported on the Rhine. The share of chemicals is much lower than within the liquid cargo transport on the Rhine. The share of biodiesel declined strongly in recent years.
- A freight rate index was calculated for three product segments.15 These nominal freight rate index values have been adjusted for the cost increase since the third quarter of 2017 (base period of the index). From the resulting deflated series, it can be observed that the evolution16 shows different trends, depending on the product segment.
- Gasoline and component freight rates have followed an upward trend since the end of 2017, also in the case of cost adjusted data. For the gasoil and components freight rates, a more recent upward trend is seen as well. For biodiesel, a strong downward trend is observed.
- Compared to the Rhine, the entire picture of CITBO freight rates shows less volatility during low waters. The FARAG region in the Netherlands and in Belgium, close to the North Sea, is certainly less affected by low waters than the Rhine in the hinterland.
- Other influencing factors for cost adjusted freight rates are the transport demand which is linked to industry production and the overall economic situation together with the supply/demand relationship.
RHINE GAUGE STATIONS
TABLE 1: HYDRAULIC PARAMETERS FOR IMPORTANT RHINE GAUGE STATIONS *
| Gauge station | Guaranteed navigation channel depth | Equivalent water level 2022 |
|---|---|---|
| Tiel (Waal, NL) | 280 cm | 255 cm |
| Nijmegen (Waal, NL) | 280 cm | 516 cm |
| IJsselkop (Nederrijn, NL) | 280 cm | 683 cm |
| Lobith (lower Rhine, NL) | 280 cm | 733 cm |
| Emmerich (lower Rhine, DE) | 280 cm | 74 cm |
| Duisburg-Ruhrort (lower Rhine, DE) | 280 cm | 227 cm |
| Cologne (lower Rhine, DE) | 250 cm | 139 cm |
| Kaub (middle Rhine, DE) | 190 cm | 77 cm |
| Oestrich (middle Rhine, DE) | 190 cm | 92 cm |
| Maxau (upper Rhine, DE) | 210 cm | 372 cm |
| Basel (upper Rhine, CH) | 300 cm | 501 cm |
Sources : WSV, Rijkswaterstaat
* Waal and Nederrijn are two branches of the Rhine delta in the Netherlands.
Number of days below Equivalent Water Level (EWL)
Sources: CCNR calculation based on data from WSV, provided by BfG, and from Rijkswaterstaat.
DANUBE GAUGE STATIONS
TABLE 2: HYDRAULIC PARAMETERS FOR IMPORTANT DANUBE GAUGE STATIONS
| Gauge station | Minimum draught in cargo transport endeavoured by waterway administration | Low navigable water level |
|---|---|---|
| Pfelling (DE) | 250 cm | 290 cm |
| Hofkirchen (DE) | 250 cm | 207 cm |
| Kienstock (AUT) | 250 cm | 161 cm |
| Wildungsmauer (AUT) | 250 cm | 155 cm |
| Devin (SK) | 250 cm | 144 cm |
| Budapest (HU) | 250 cm | 102 cm |
| Bezdan (RS) | 250 cm | -10 cm |
| Calafat (RO) | 250 cm | -5 cm |
| Calarasi (RO) | 250 cm | -32 cm |
| Lom (BG) | 250 cm | 144 cm |
| Silistra (BG) | 250 cm | 80 cm |
Source: Danube Commission
Number of days below the low navigable water level (LNWL)
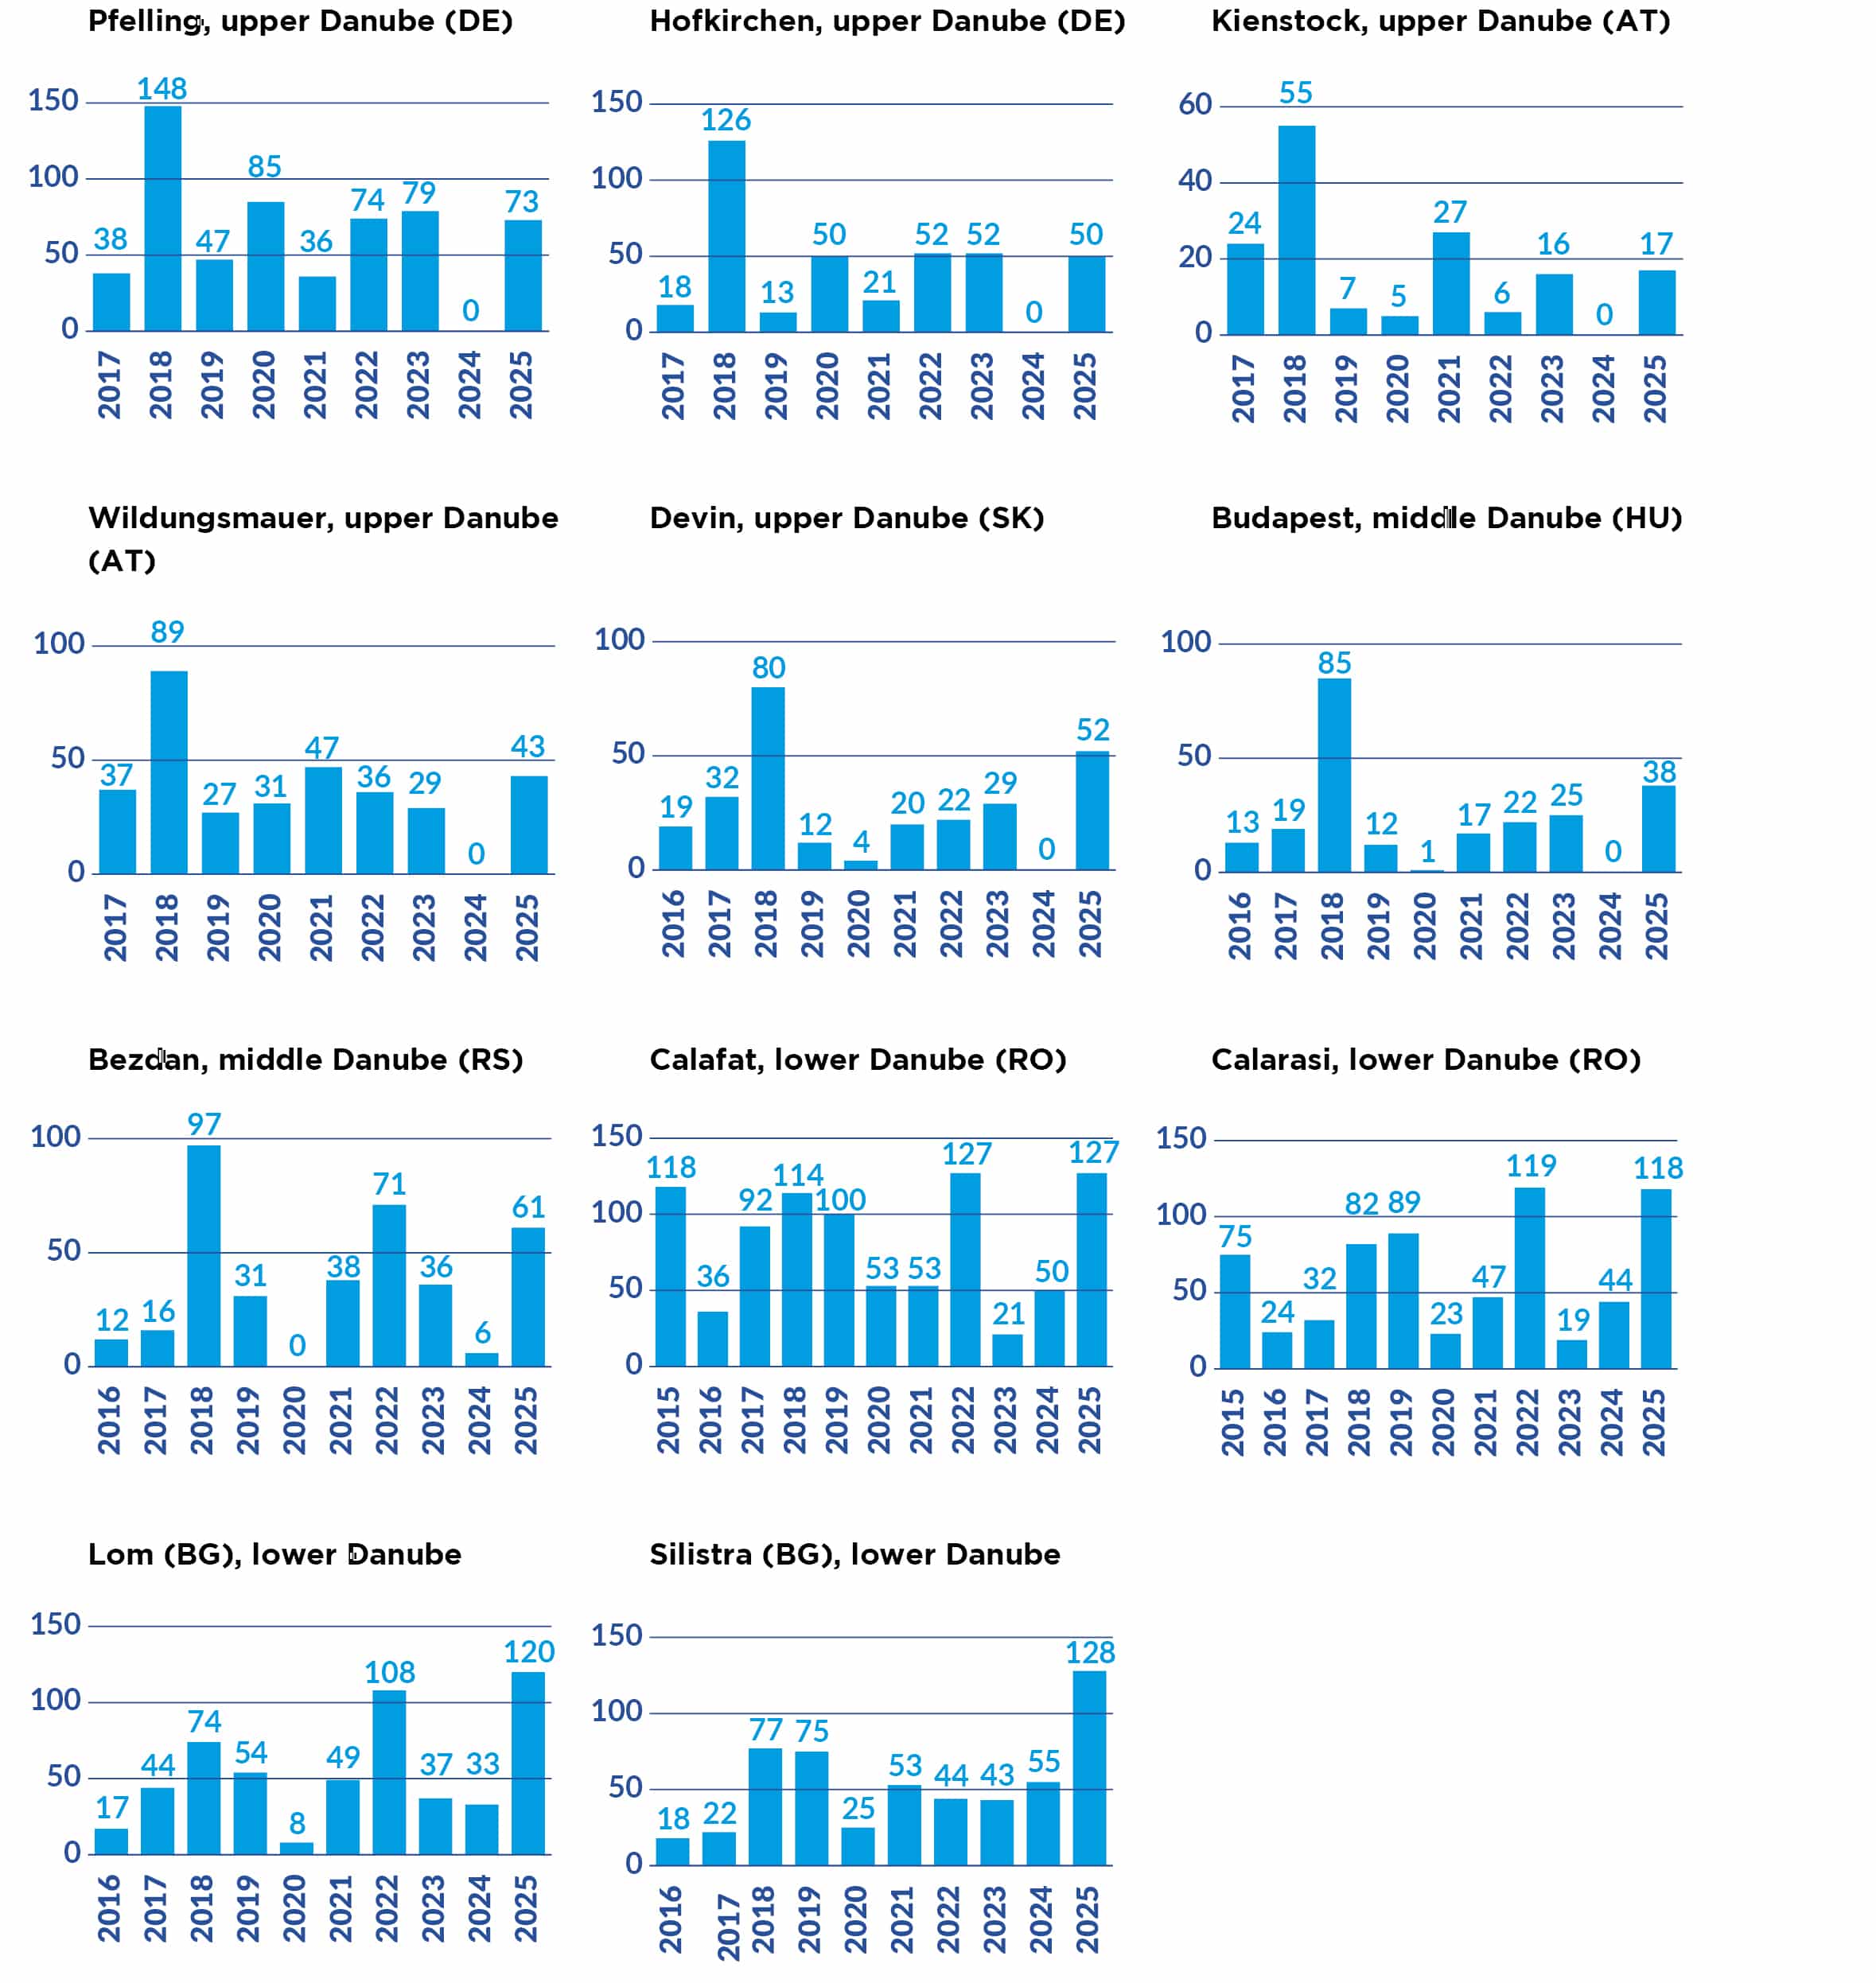
Sources: CCNR calculation based on data from WSV, provided by BfG, data from the Federal State of Lower Austria and the Danube Commission
FREIGHT RATES IN THE RHINE REGION
LIQUID CARGO FREIGHT RATES IN THE RHINE REGION
FIGURE 3: INSIGHTS GLOBAL FREIGHT RATE INDEX FOR LIQUID CARGO TRANSPORT (GASOIL) IN THE ARA-RHINE TRADE (2004 = 100), NOT ADJUSTED FOR COST INCREASE
ch3_fig3_raw data
Sources: CCNR calculation based on Insights Global.
Lower Rhine = average of the destinations Duisburg and Cologne; upper Rhine = Average of the destinations Karlsruhe and Basel; Main = Destination Frankfurt/Main.
TABLE 3: STRUCTURE OF COST INDEX FOR TANKER BARGING ON THE RHINE
| Cost component | Share in total costs (weight within the index) | Reason for share | Source of data |
|---|---|---|---|
| Fuel (Gasoil) | 30% | High fuel consumption | Destatis gasoil price index |
| Crew | 25% | Expensive crew, high technical level | Panteia cost monitoring |
| Capital | 20% | High price of double hull tankers | Long run interest rates for loans (according to data collected by the German Central Bank) plus risk premium (2.5%), shipbuilding and metal price index (Destatis) for amortisation |
| Repair and maintenance | 15% | High standards for tankers | Panteia cost monitoring |
| Insurance | 6% | High environmental risks | Panteia cost monitoring |
| Other costs | 4% | Administration, IT | Panteia cost monitoring |
| Total costs | 100% | Entire costs | - |
FIGURE 4: COMBINED COST INDEX IN TANKER BARGING (2004 = 100) *
ch3_fig4_raw data
Sources: CCNR calculation based on Panteia, Destatis, German Central Bank (Bundesbank)
* Combined cost index = 0.3 × Fuel costs + 0.25 × Crew costs + 0.20 × Capital costs + 0.15 × Repair and maintenance costs + 0.06 × Insurance costs + 0.04 × Other costs.
TABLE 4: REASONS FOR THE COST INCREASE IN TANKER BARGING SINCE 2004
| Cost component | Growth rate of costs since 2004 | Reasons for increasing trend since 2004 |
|---|---|---|
| Fuel (Gasoil) | 82% | Highly volatile; following the business cycle and external shocks (geopolitical tensions) |
| Crew | 95% | Steady rise due to a shortage of skilled labour, especially in tanker barging |
| Capital | 51% | Sharp increase due to double-hull investments (2012–2018), rising steel and shipyard prices and recent interest rate hikes |
| Repair and maintenance | 136% | Rising prices for steel and electricity, limited shipyard capacity |
| Insurance | 100% | Higher liability premiums for hazardous goods, increased vessel values (double-hull), and stricter environmental risk assessments |
| Other costs | 68% | Rising administrative burdens, costs for digitalisation, port and lock dues, and increased expenses for safety certifications |
| Total costs | 88% | The weighted aggregate of all sub-indices, reflecting a structural shift towards a high-cost environment in the European inland waterway sector |
Sources: CCNR calculation based on Panteia, Destatis, German Central Bank (Bundesbank)
FIGURE 5: INSIGHTS GLOBAL FREIGHT RATE INDEX FOR LIQUID CARGO (GASOIL) TRANSPORT IN THE ARA-RHINE TRADE TRANSPORT IN THE ARA-RHINE TRADE (2004 = 100), ADJUSTED FOR COST INCREASE
ch3_fig5_raw data
Sources: CCNR calculation based on Insights Global, Panteia, Destatis, German Central Bank (Bundesbank).
Lower Rhine = average of the destinations Duisburg and Cologne; upper Rhine = Average of the destinations Karlsruhe and Basel; Main = Destination Frankfurt/Main.
CBS FREIGHT RATE INDEX FOR THE RHINE REGION
FIGURE 6: CBS FREIGHT RATE INDICES PER QUARTER (2021 = 100), NOT ADJUSTED FOR COST INCREASE *
ch3_fig6_raw data
Source: Statistical Office of the Netherlands (CBS) (Binnenvaartdiensten; prijsindex), Table 85817 2021=100
* The prices of established routes are observed twice a quarter and include fuel and low water surcharges but exclude loading and unloading. The time of observation is in the middle and at the end of the quarter. All prices are nominal prices.
TABLE 5: STRUCTURE OF COST INDEX FOR DRY BULK AND CONTAINER TRANSPORT ON THE RHINE
| Cost component | Share in dry bulk transport (%) | Share in container transport (%) | Source of data |
|---|---|---|---|
| Fuel (Gasoil) | 35% | 28% | Destatis gasoil price index |
| Crew | 25% | 22% | Panteia cost monitoring |
| Capital | 15% | 22% | German Central Bank / Destatis Metal Index |
| Repair & Maintenance | 12% | 10% | Panteia cost monitoring |
| Insurance | 3% | 5% | Panteia cost monitoring |
| Other costs | 10% | 13% | Panteia cost monitoring |
| Total | 100% | 100% | - |
FIGURE 7: CBS FREIGHT RATE INDICES PER QUARTER (2021 = 100), ADJUSTED FOR COST INCREASE
ch3_fig7_raw data
Sources: CCNR analysis based on CBS (Binnenvaartdiensten; prijsindex), Table 85817 2021=100
CITBO LIQUID CARGO FREIGHT RATE INDEX FOR THE FARAG REGION
-
Geography of the CITBO transport activity and product segment structure
Results of the calculation of freight rate indices (spot market data)
FIGURES 8, 9, AND 10: CITBO FREIGHT RATE INDEX FOR LIQUID CARGO SEGMENTS (INDEX Q3 2017 = 100), ADJUSTED FOR COST INCREASE
ch3_fig8_raw data
ch3_fig9_raw data
ch3_fig10_raw data
Sources: CCNR analysis based on spot market data provided by CITBO and combined cost index for liquid cargo transport