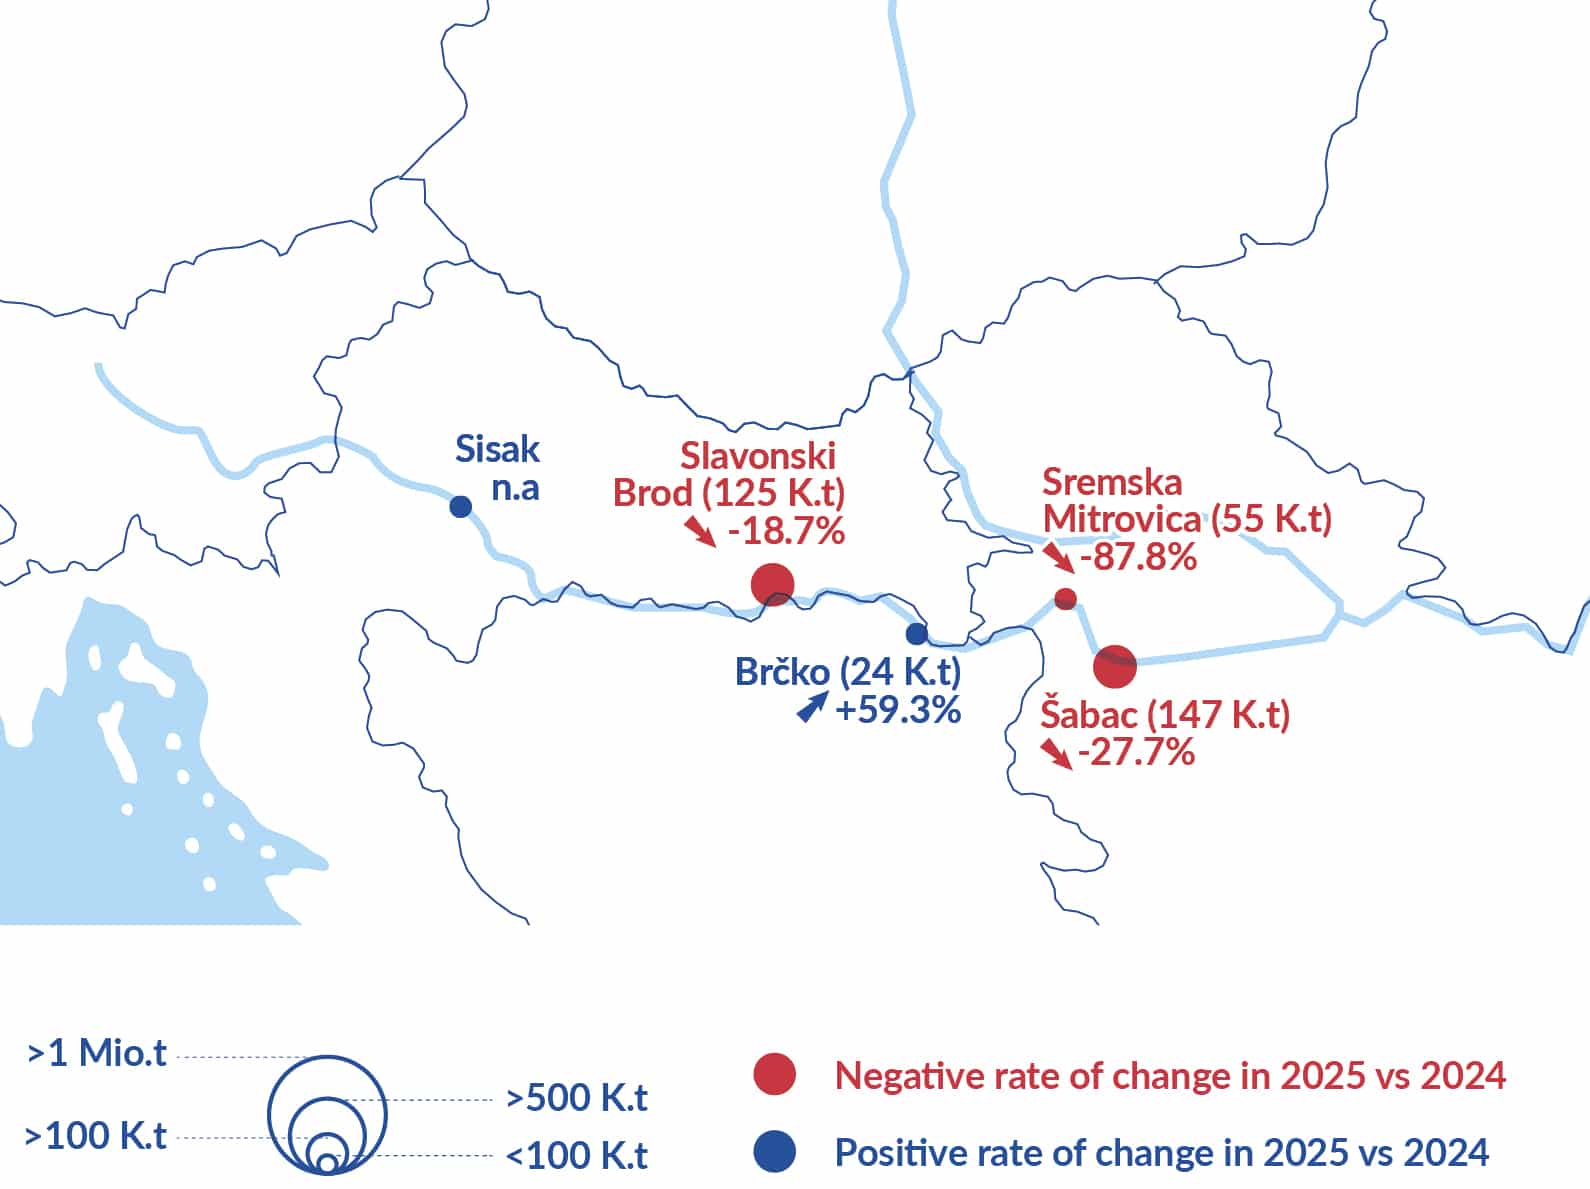
• Inland waterway cargo handling in Europe’s main seaports reflected the weaker economic environment in 2025. The Ports of Rotterdam, Antwerp-Bruges and North Sea Port remained the largest inland waterway hubs in Europe, but cargo handling trends diverged across ports.
• The Port of Rotterdam remained broadly stable, Antwerp-Bruges recorded a slight decline due to weaker liquid bulk and chemical traffic, while Hamburg recorded an increase in hinterland traffic, supported by stronger container-related activity.
• On the Danube corridor, the Port of Constanţa remained a key gateway for regional trade and Ukrainian exports. However, traffic continued to be influenced by changing export routes, with the reopening of the Ukrainian Black Sea seaports reducing some grain flows through the Danube and Constanţa.
MAIN EUROPEAN SEAPORTS
- In 2025, 93,680 inland vessels called at the Port of Rotterdam (91,356 in 2024).
- The volumes of inland waterway cargo handling at the Port of Rotterdam experienced a slight decrease of -0.2% to 141.6 million tonnes in 2025 (compared to 141.9 million tonnes in 2024). Whereas the dry bulk segment slightly increased (+0.2%), the liquid bulk segment experienced a -2.4% decline. In fact, the total maritime liquid bulk throughput was impacted by the decrease of mineral oil products and chemical products which also had consequences for IWT. This also reflects the situation observed for the transport of these two cargo segments on the Rhine (see section on the Rhine basin, chapter 2).
- The container segment again showed positive results (+3.2%) in line with the upward trend observed for national container traffic in the Netherlands.17
- The IWW modal split within total throughput in 2024 was 37.1% at the Port of Rotterdam (ahead of pipeline (33.4%), road (22.5%) and rail (7.1%)). The 2025 IWW modal split share within container transport to and from the hinterland was 29.8%18 (behind road (61.2%) and ahead of rail (9.0%)).
- In 2025, the number of inland vessels which called at the port decreased to 56,229 (compared to 57,223 in 2024).
- Liquid bulk is the most important cargo type (approximately 60%), followed by containers (approximately 20%) and dry bulk (approximately 15%).
- The current geopolitical tensions, economic uncertainty, and industrial action weighed on the activities of the Port of Antwerp-Bruges in 2025. The IWW cargo handling indeed slightly decreased in 2025 (-3.3% compared to 2024), reaching a volume of 98.7 million tonnes (compared to 102.0 in 2024). This result was driven by a decrease in the transport of liquid bulk (-4.8%), both for the transport of petroleum products and the transport of chemicals. In fact, gasoline exports to West Africa were lower and diesel imports were reduced on the maritime side, which negatively influenced volumes handled by inland waterways. Furthermore, the European chemicals sector has remained weak due to high energy costs in Europe, limited demand growth and reduced production.
- The decrease of dry bulk (-3.0%) was mainly driven by the transhipment of agricultural products, petroleum products, crude minerals and building materials.
- With regard to container transport, it remained stable between 2024 and 2025 (+0.7%).
- The IWW modal split within total maritime throughput (excluding industrial traffic19) in 2025 was 53.4% at the Port of Antwerp (51% in 2024), the highest share since 2019. The IWW modal split share within container transport to and from the hinterland was 32.7% in 2025, ahead of rail (7.5%) and behind road (59.9%).
- In 2025, 37,973 inland vessels called in at North Sea Port (Ghent, Terneuzen, Flushing), compared to 38,242 in 2024.
- Despite a slight overall increase in maritime transhipment (67 million tonnes, +0.4%), inland waterway transhipment fell by -4.3% in 2025, reaching 61.5 million tonnes (after a strong +4.5% rise in 2024 to 64.3 million tonnes). The drop in 2025 can be partly interpreted as a catch up effect: the strong increase in 2024 created a high baseline, making a subsequent decline more likely, especially in a context of weaker macroeconomic conditions and lower industrial output.
- Dry bulk experienced a sharp decrease (-8.7%, 21.3 million tonnes), driven by reduced transport of building materials (minerals, sand), iron ores and feed products. Liquid bulk also declined slightly (-0.6%, 34.3 million tonnes), reflecting lower industrial output and therefore reduced transport of chemical products. Container transport also fell (-3.2%, 2.2 million tonnes), in line with a decrease in traded manufactured goods.
- As for the modal split within hinterland transport (2024), inland navigation ranks first with a 62% share, followed by road (25%), rail (10%) and transhipment or feeder traffic (3%). Since 2018, inland waterway transport has gained 8 percentage points.
- In Constanţa, 9,343 inland vessels called at the port in 2025, compared with 11,085 in 2024, marking a significant reduction from the levels recorded in both 2023 and 2024. This decline mirrors the drop observed in maritime traffic and IWW traffic at the Port of Constanţa. The main factor behind this trend is the resumption of activities in Ukrainian ports, which has ended the exceptional increase in transit flows through Constanţa seen in 2023 and 2024 under the impulse of the EU-Ukraine Solidarity Lanes, particularly for cereal exports from Ukraine.
- In 2025, IWW cargo traffic decreased by -23.8% compared with 2024, amounting to 13.1 million tonnes. This decline was driven primarily by a -38.4% drop in transit traffic, which has now returned to volumes comparable to those recorded before the start of the war.
- Regarding cargo structure, dry bulk remains the dominant segment, accounting for nearly 80% of total IWT cargo handled at the port. In 2025, dry bulk volumes fell by -28.8% compared with 2024. By contrast, liquid bulk increased slightly by +0.6%. Container traffic and general cargo also declined but remain marginal segments compared with liquid bulk and dry bulk combined.
- Overall, IWT traffic in Constanţa continues to consist mainly of transit traffic and cabotage.
- After two years of recession, the German economy recorded only marginal growth in 2025 and stabilised towards the end of the year. Nevertheless, several economic indicators showed improvements compared with 2024. In this context, IWT cargo handling increased slightly by +0.2%, reaching 6.0 million tonnes in 2025.
- Overall, the Port of Hamburg recorded an increase in hinterland traffic, supported by the introduction of new liner services calling at Hamburg for the first time, including routes to Southern Europe, the Mediterranean region, and South America. These developments had a positive impact on container throughput. The inland navigation container segment benefited particularly, as reflected in a +14.8% increase between 2024 and 2025, following a continuous decline since 2021 driven by a challenging macroeconomic environment.20
- Among dry cargo, the segment of agricultural products decreased by -14.6% while the segment of sand, stones and gravel increased by +15.4% compared to 2024.
- Concerning liquid cargo, despite the good results of the chemical products’ segment (+37.3%), volumes declined by -4.5% between 2024 and 2025 and were mainly driven by a decline in the transport of mineral oil products (-7.6%).
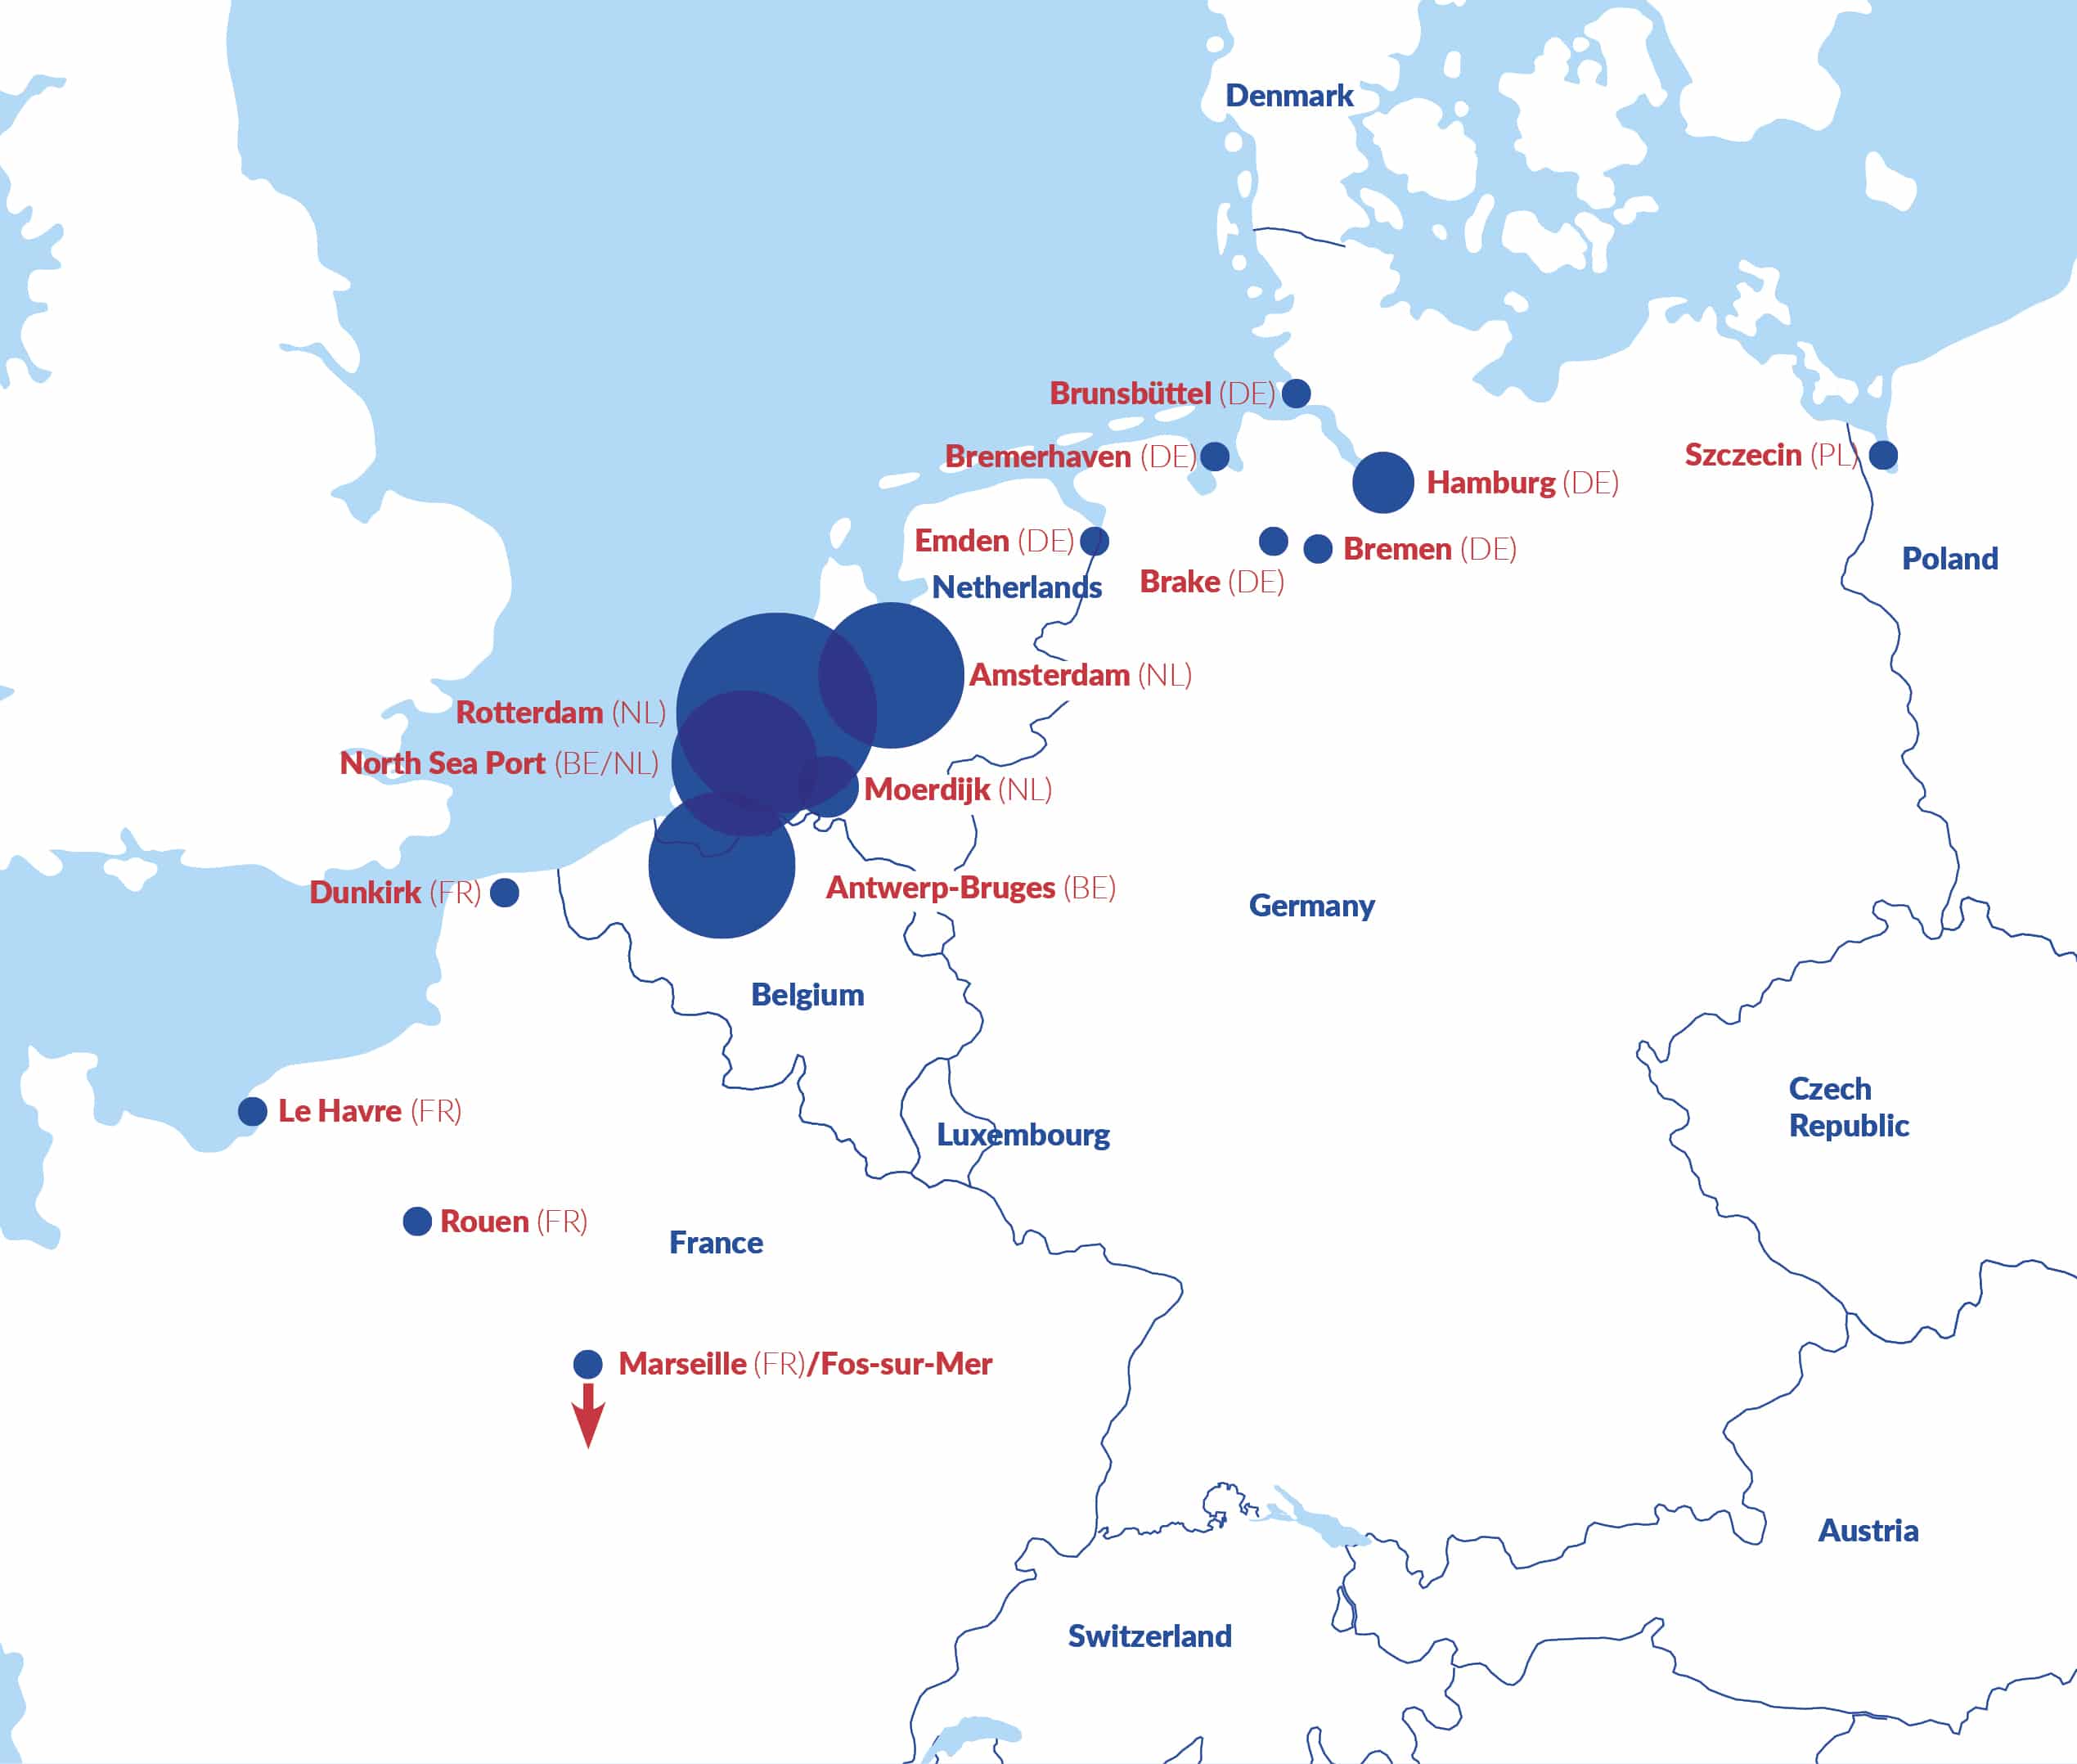
Sources: ports’ statistics, Destatis, CBS, Eurostat [iww_go_aport] and Danube Commission
Data from 2025.
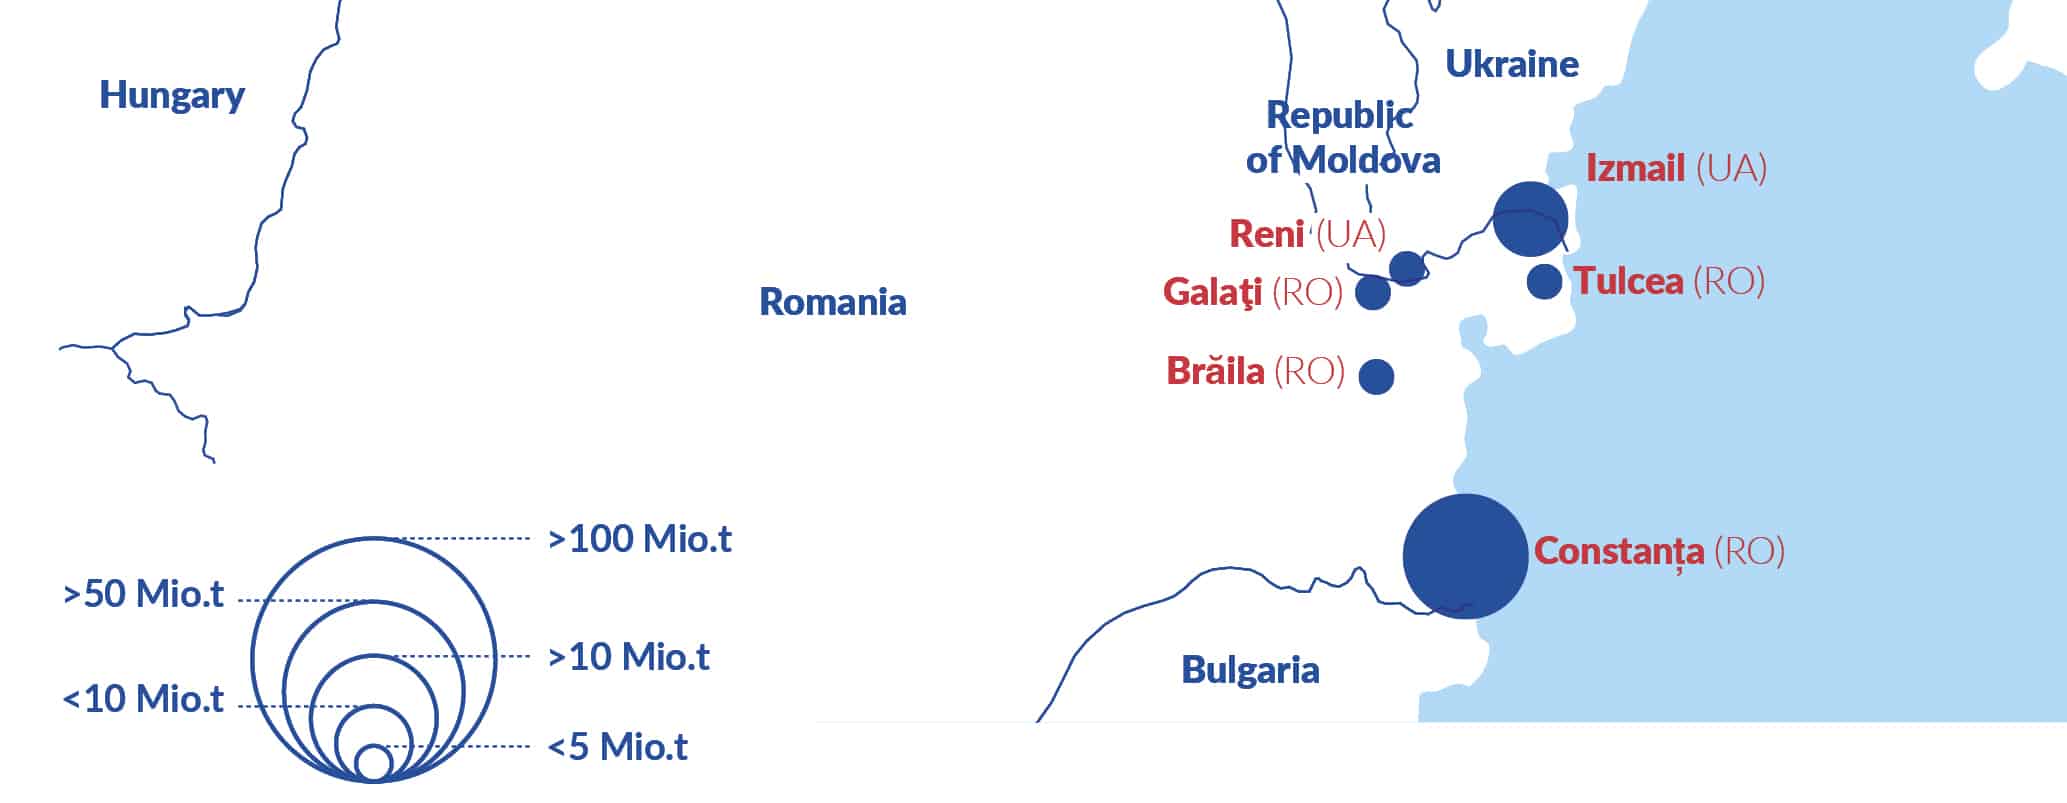
Source: Romanian national institute of statistics
ROTTERDAM
FIGURE 1: INLAND WATERWAY CARGO HANDLING IN THE SEAPORT OF ROTTERDAM (IN MILLION TONNES)
ch4_fig1_raw data
Source: CBS
FIGURE 2: INLAND WATERWAY CARGO HANDLING IN THE SEAPORT OF ROTTERDAM PER TYPE OF CARGO (IN MILLION TONNES) *
ch4_fig2_raw data
Source: CBS
* General cargo is not taken into account in these calculations. In 2025, the volume transported for general cargo amounted to 2.8 million tonnes.
ANTWERP-BRUGES
FIGURE 3: INLAND WATERWAY CARGO HANDLING IN THE SEAPORT OF ANTWERP-BRUGES (IN MILLION TONNES) *
ch4_fig3_raw data
Source: Port of Antwerp-Bruges
* From 2021 onwards, figures are reported under Port of Antwerp Bruges, following the merger of the ports of Antwerp and Zeebrugge. Earlier data refer to the Port of Antwerp only.
FIGURE 4: INLAND WATERWAY CARGO HANDLING IN THE SEAPORT OF ANTWERP-BRUGES PER TYPE OF CARGO (IN MILLION TONNES) *
ch4_fig4_raw data
Source: Port of Antwerp-Bruges
* Ro/ro, general and not assigned goods are not taken into account in these calculations (in 2025, the volume transported for these three cargo types amounted to 7.0 million tonnes mostly attributed to general goods).
From 2021 onwards, figures for inland waterway cargo handling at the Port of Antwerp and Zeebrugge appear under the name “Port of Antwerp-Bruges”.
NORTH SEA PORT
FIGURE 5: INLAND WATERWAY CARGO HANDLING IN THE NORTH SEA PORT (IN MILLION TONNES)
ch4_fig5_raw data
Source: North Sea Port
FIGURE 6: INLAND WATERWAY CARGO HANDLING IN THE NORTH SEA PORT PER TYPE OF CARGO (IN MILLION TONNES) *
ch4_fig6_raw data
Source: North Sea Port
* Ro/ro and conventional cargo are not taken into account in these calculations (in 2025, the volume transported for these two cargo types amounted to 0.1 million tonnes and 3.6 million tonnes respectively).
CONSTANŢA
FIGURE 7: INLAND WATERWAY CARGO HANDLING IN THE SEAPORT OF CONSTANŢA PER TYPE OF CARGO (IN MILLION TONNES)
ch4_fig7_raw data
Source: port of Constanţa
HAMBURG
FIGURE 8: INLAND WATERWAY CARGO HANDLING IN THE SEAPORT OF HAMBURG (IN MILLION TONNES)
ch4_fig8_raw data
Source: Statistical Office of Hamburg and Schleswig-Holstein
FIGURE 9: INLAND WATERWAY CARGO HANDLING IN THE SEAPORT OF HAMBURG PER TYPE OF CARGO (IN MILLION TONNES) *
ch4_fig9_raw data
Source: Statistical Office of Hamburg and Schleswig-Holstein
* General cargo is not taken into account in these calculations (in 2025, the volume transported for this cargo type amounted to 0.1 million tonnes).
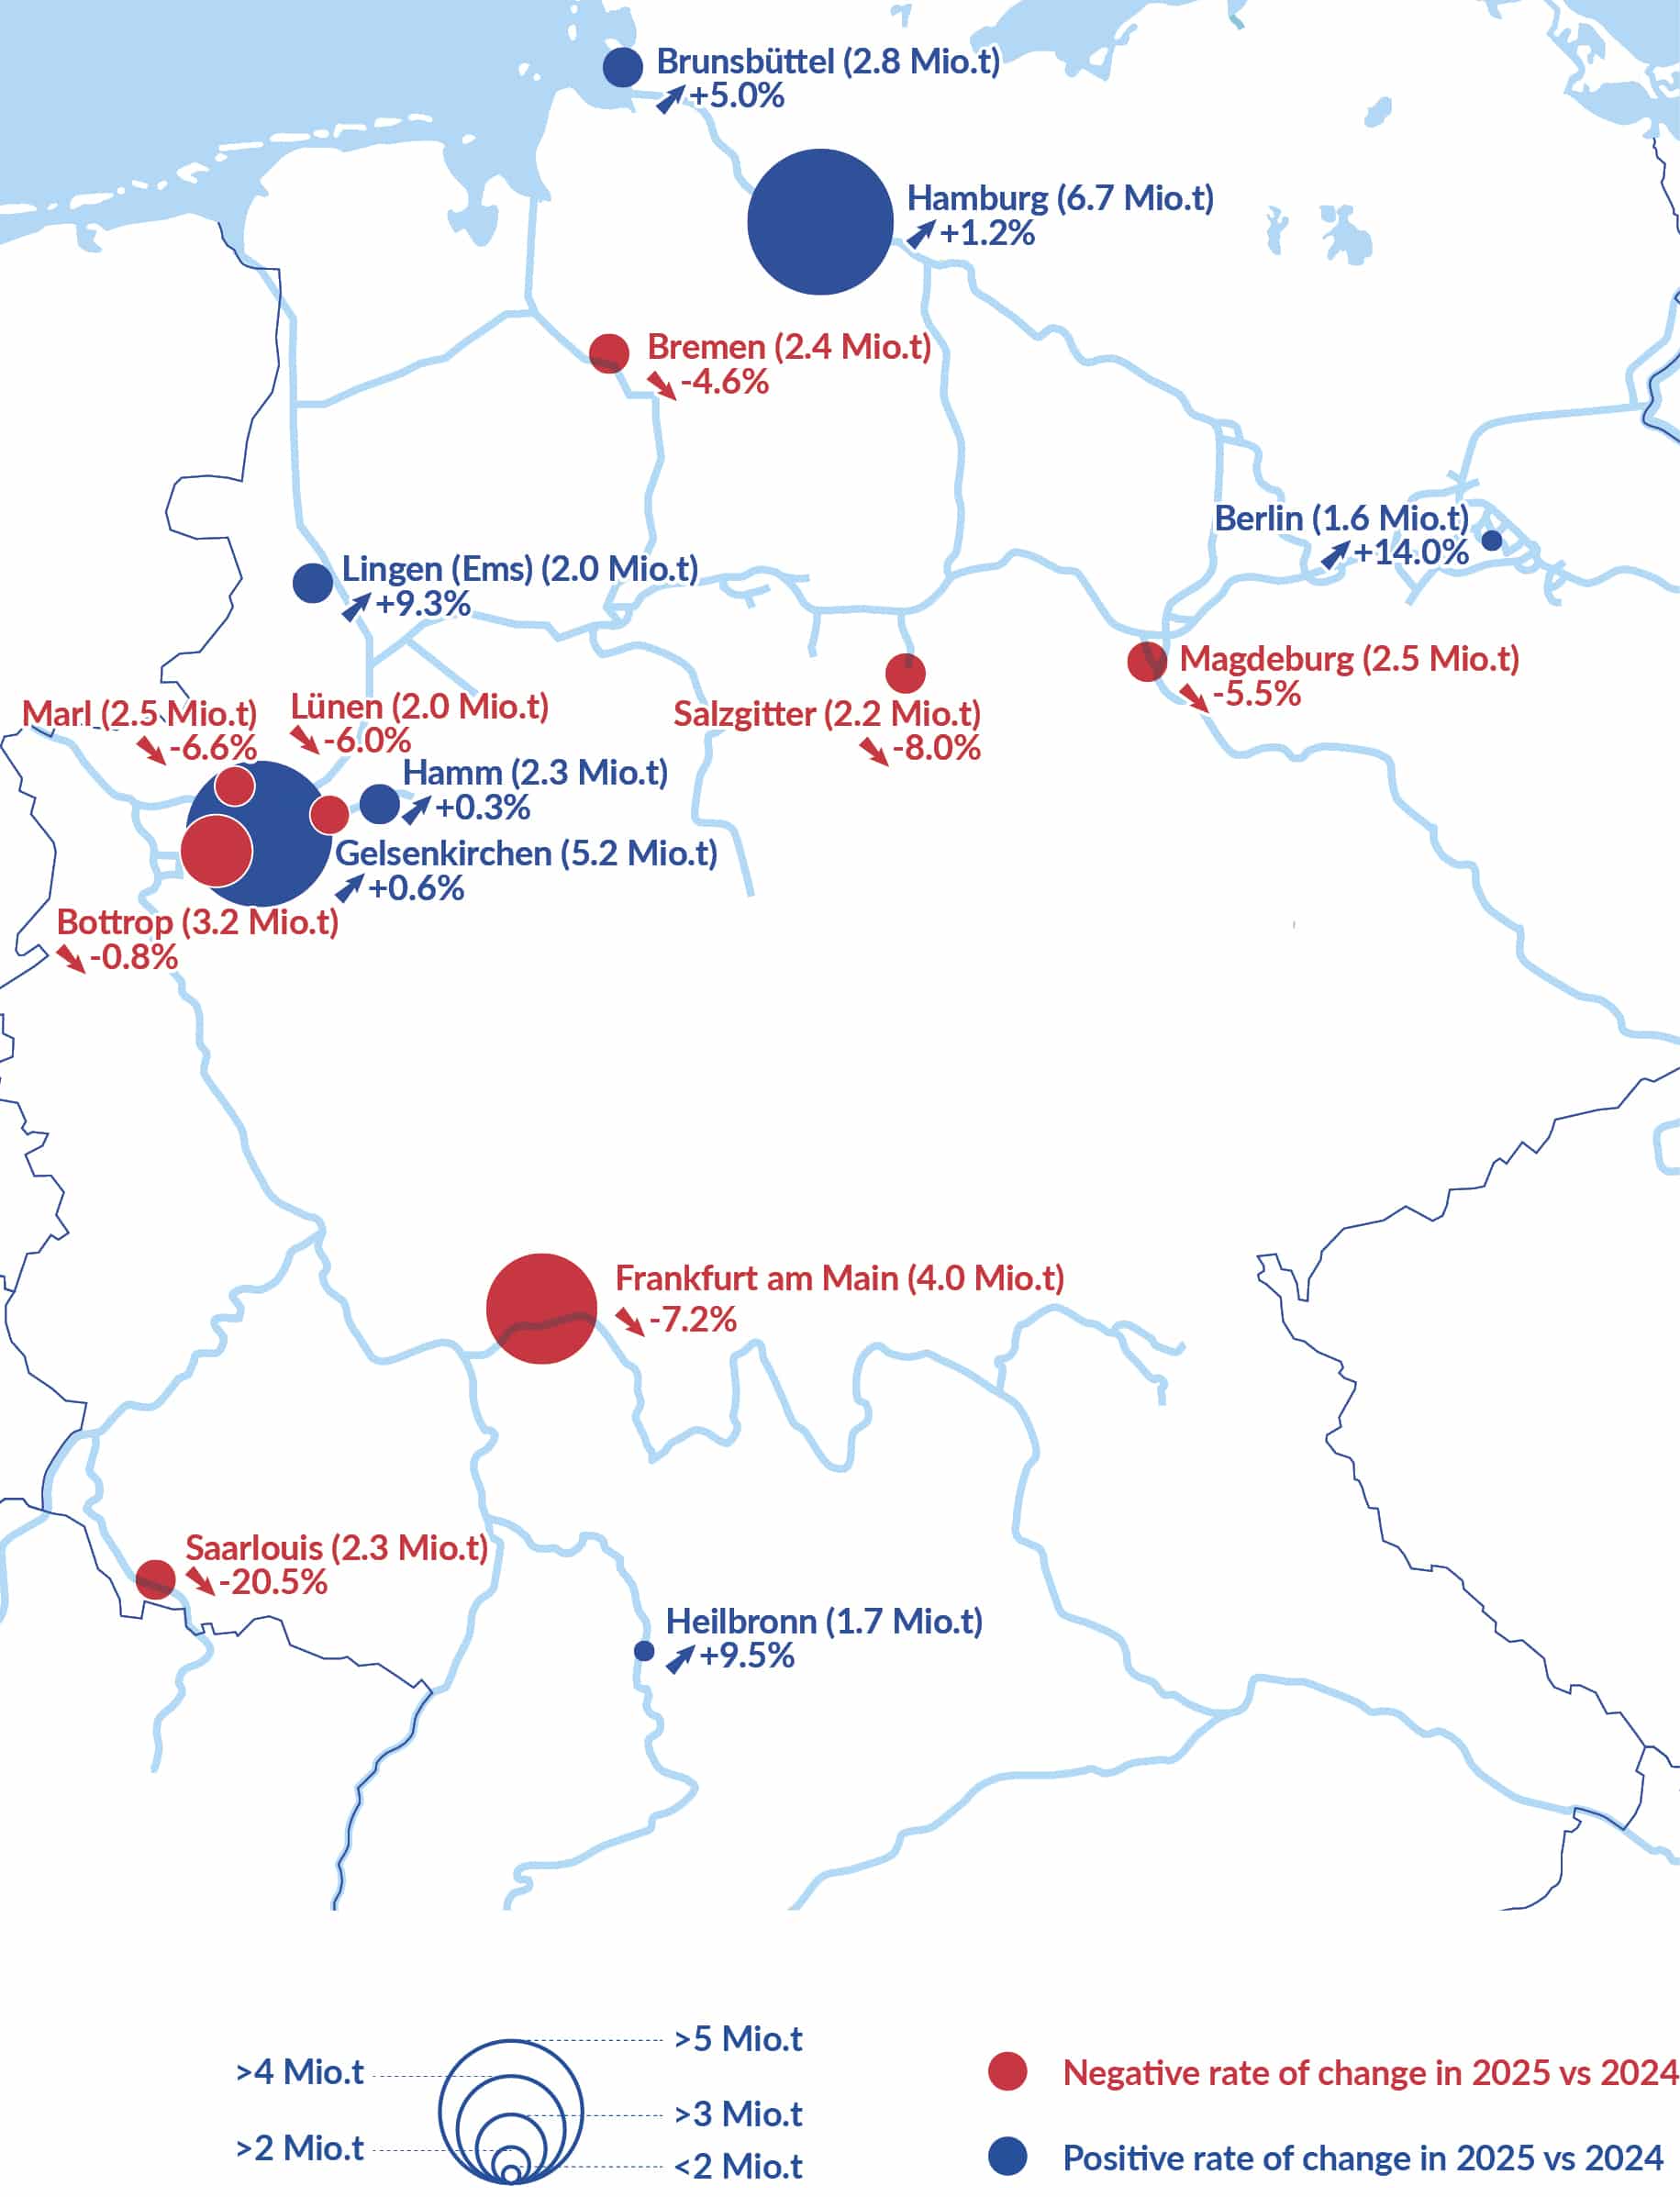
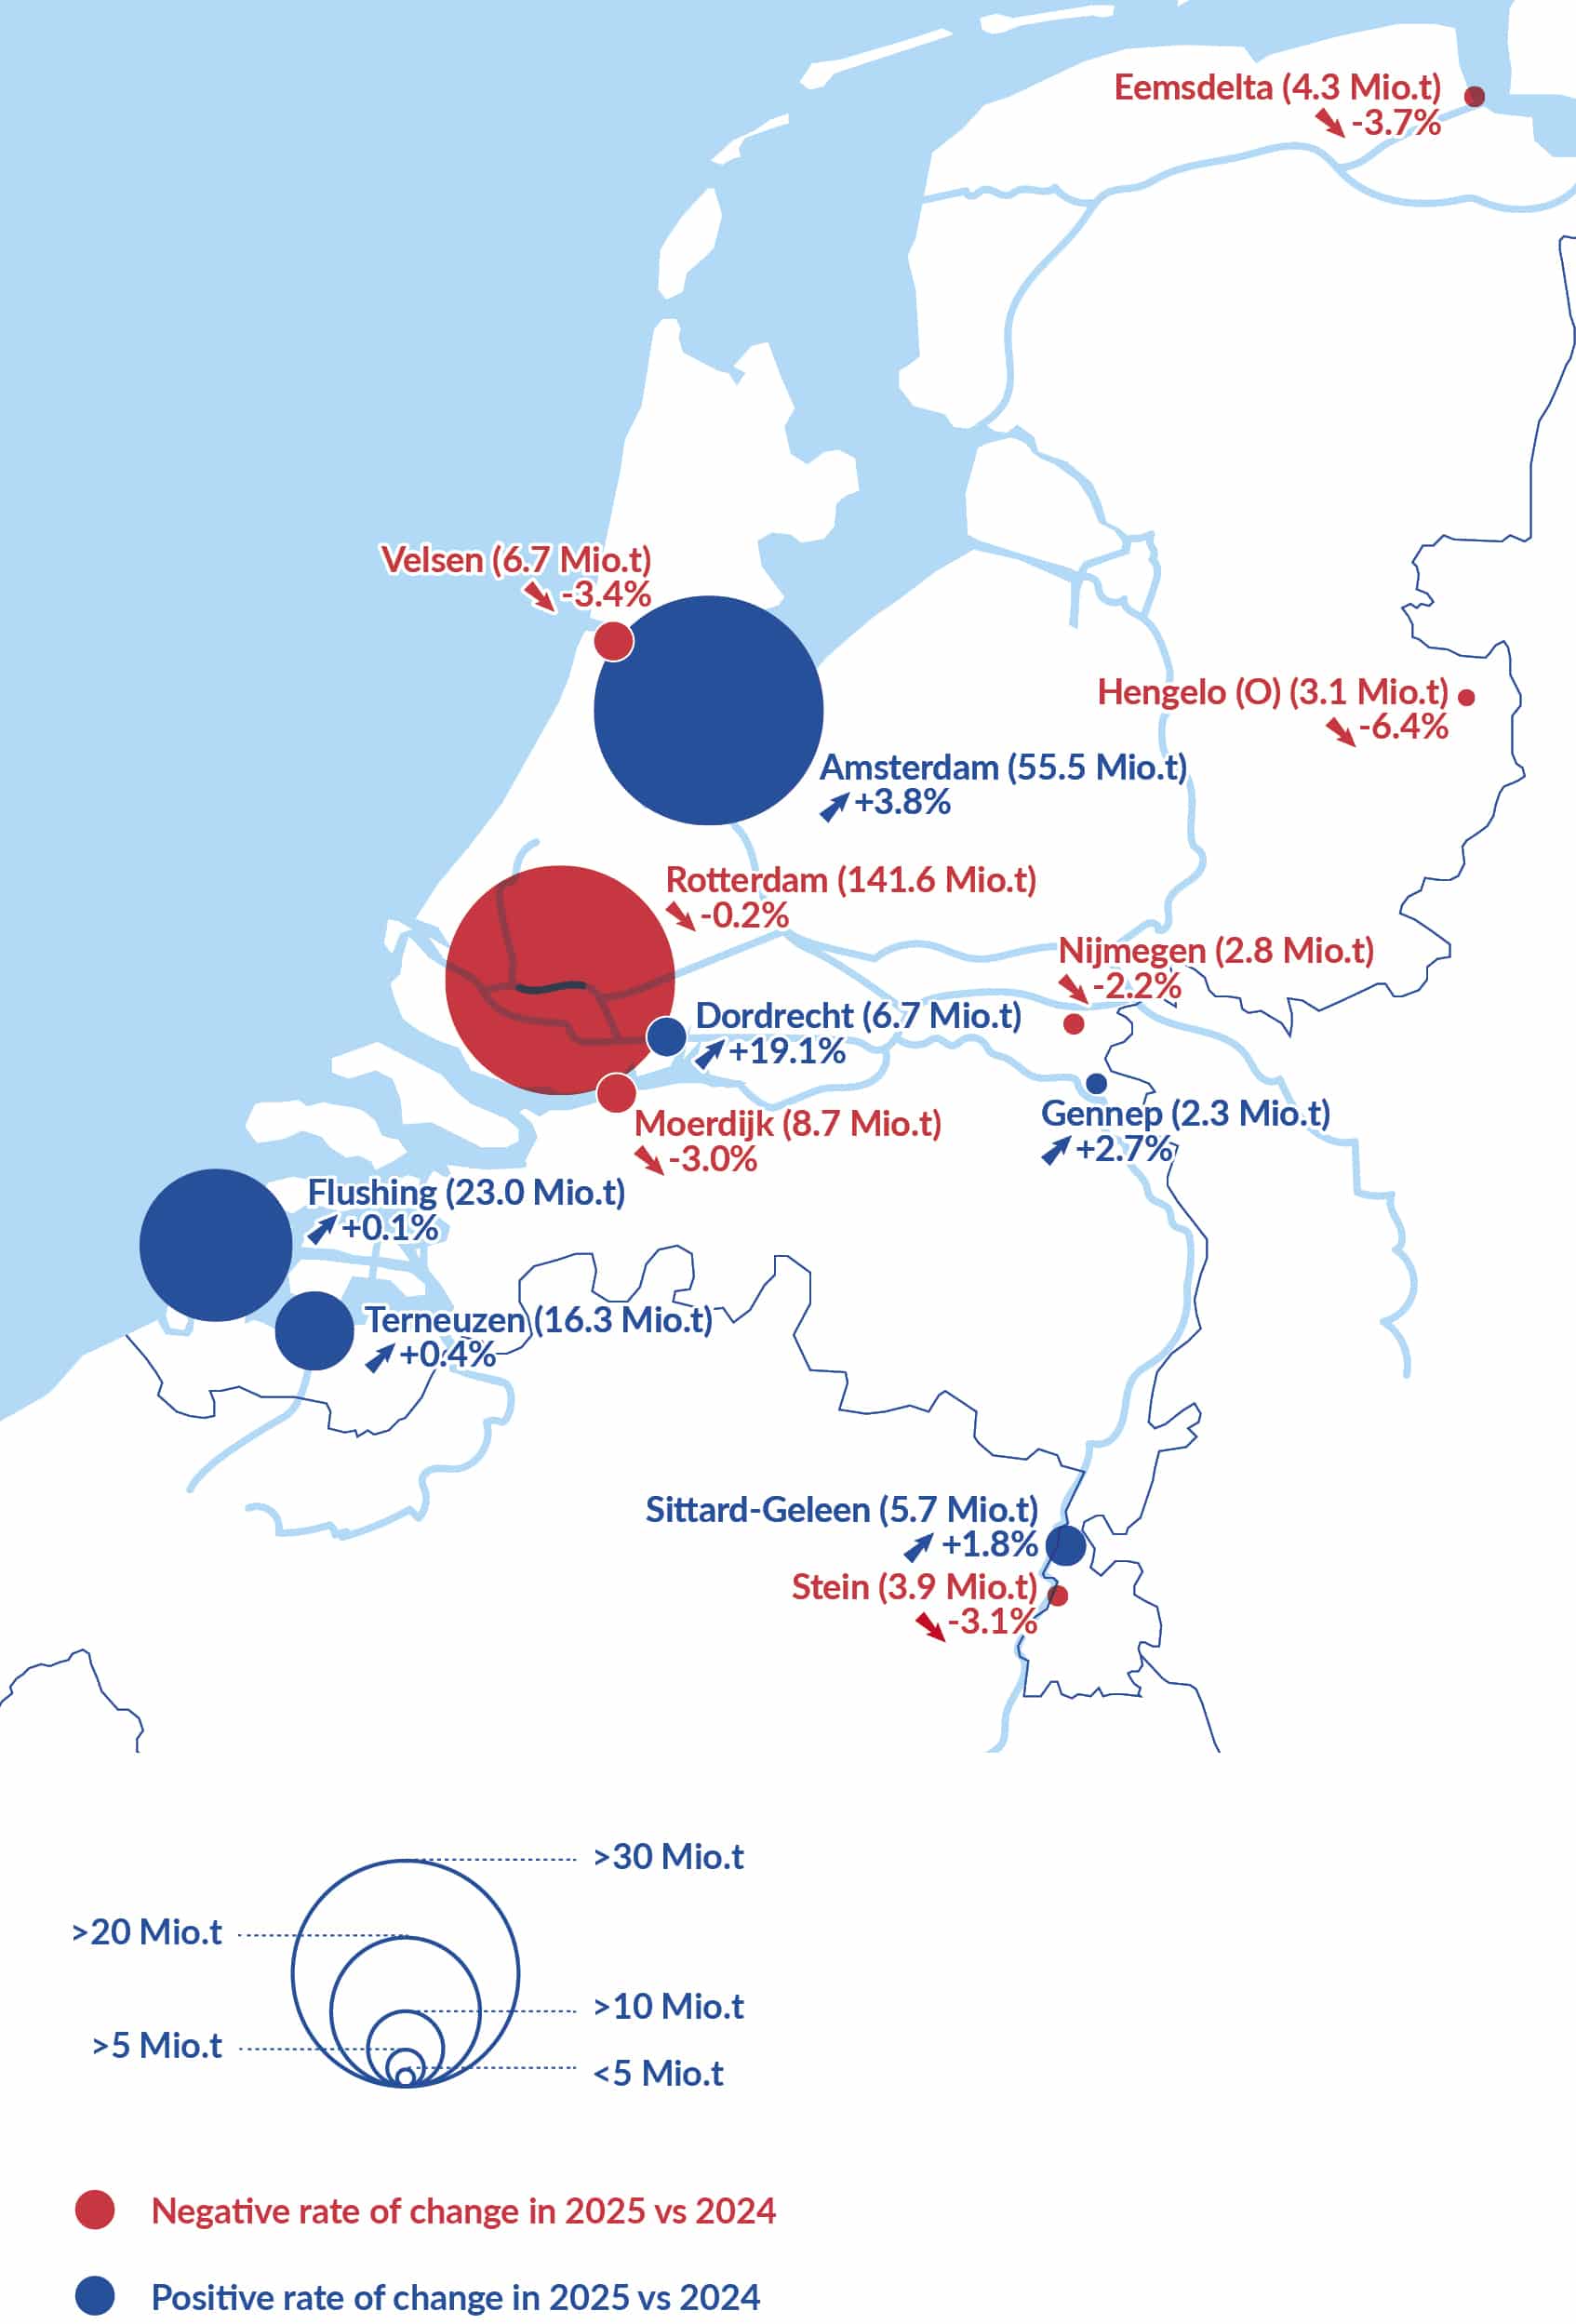
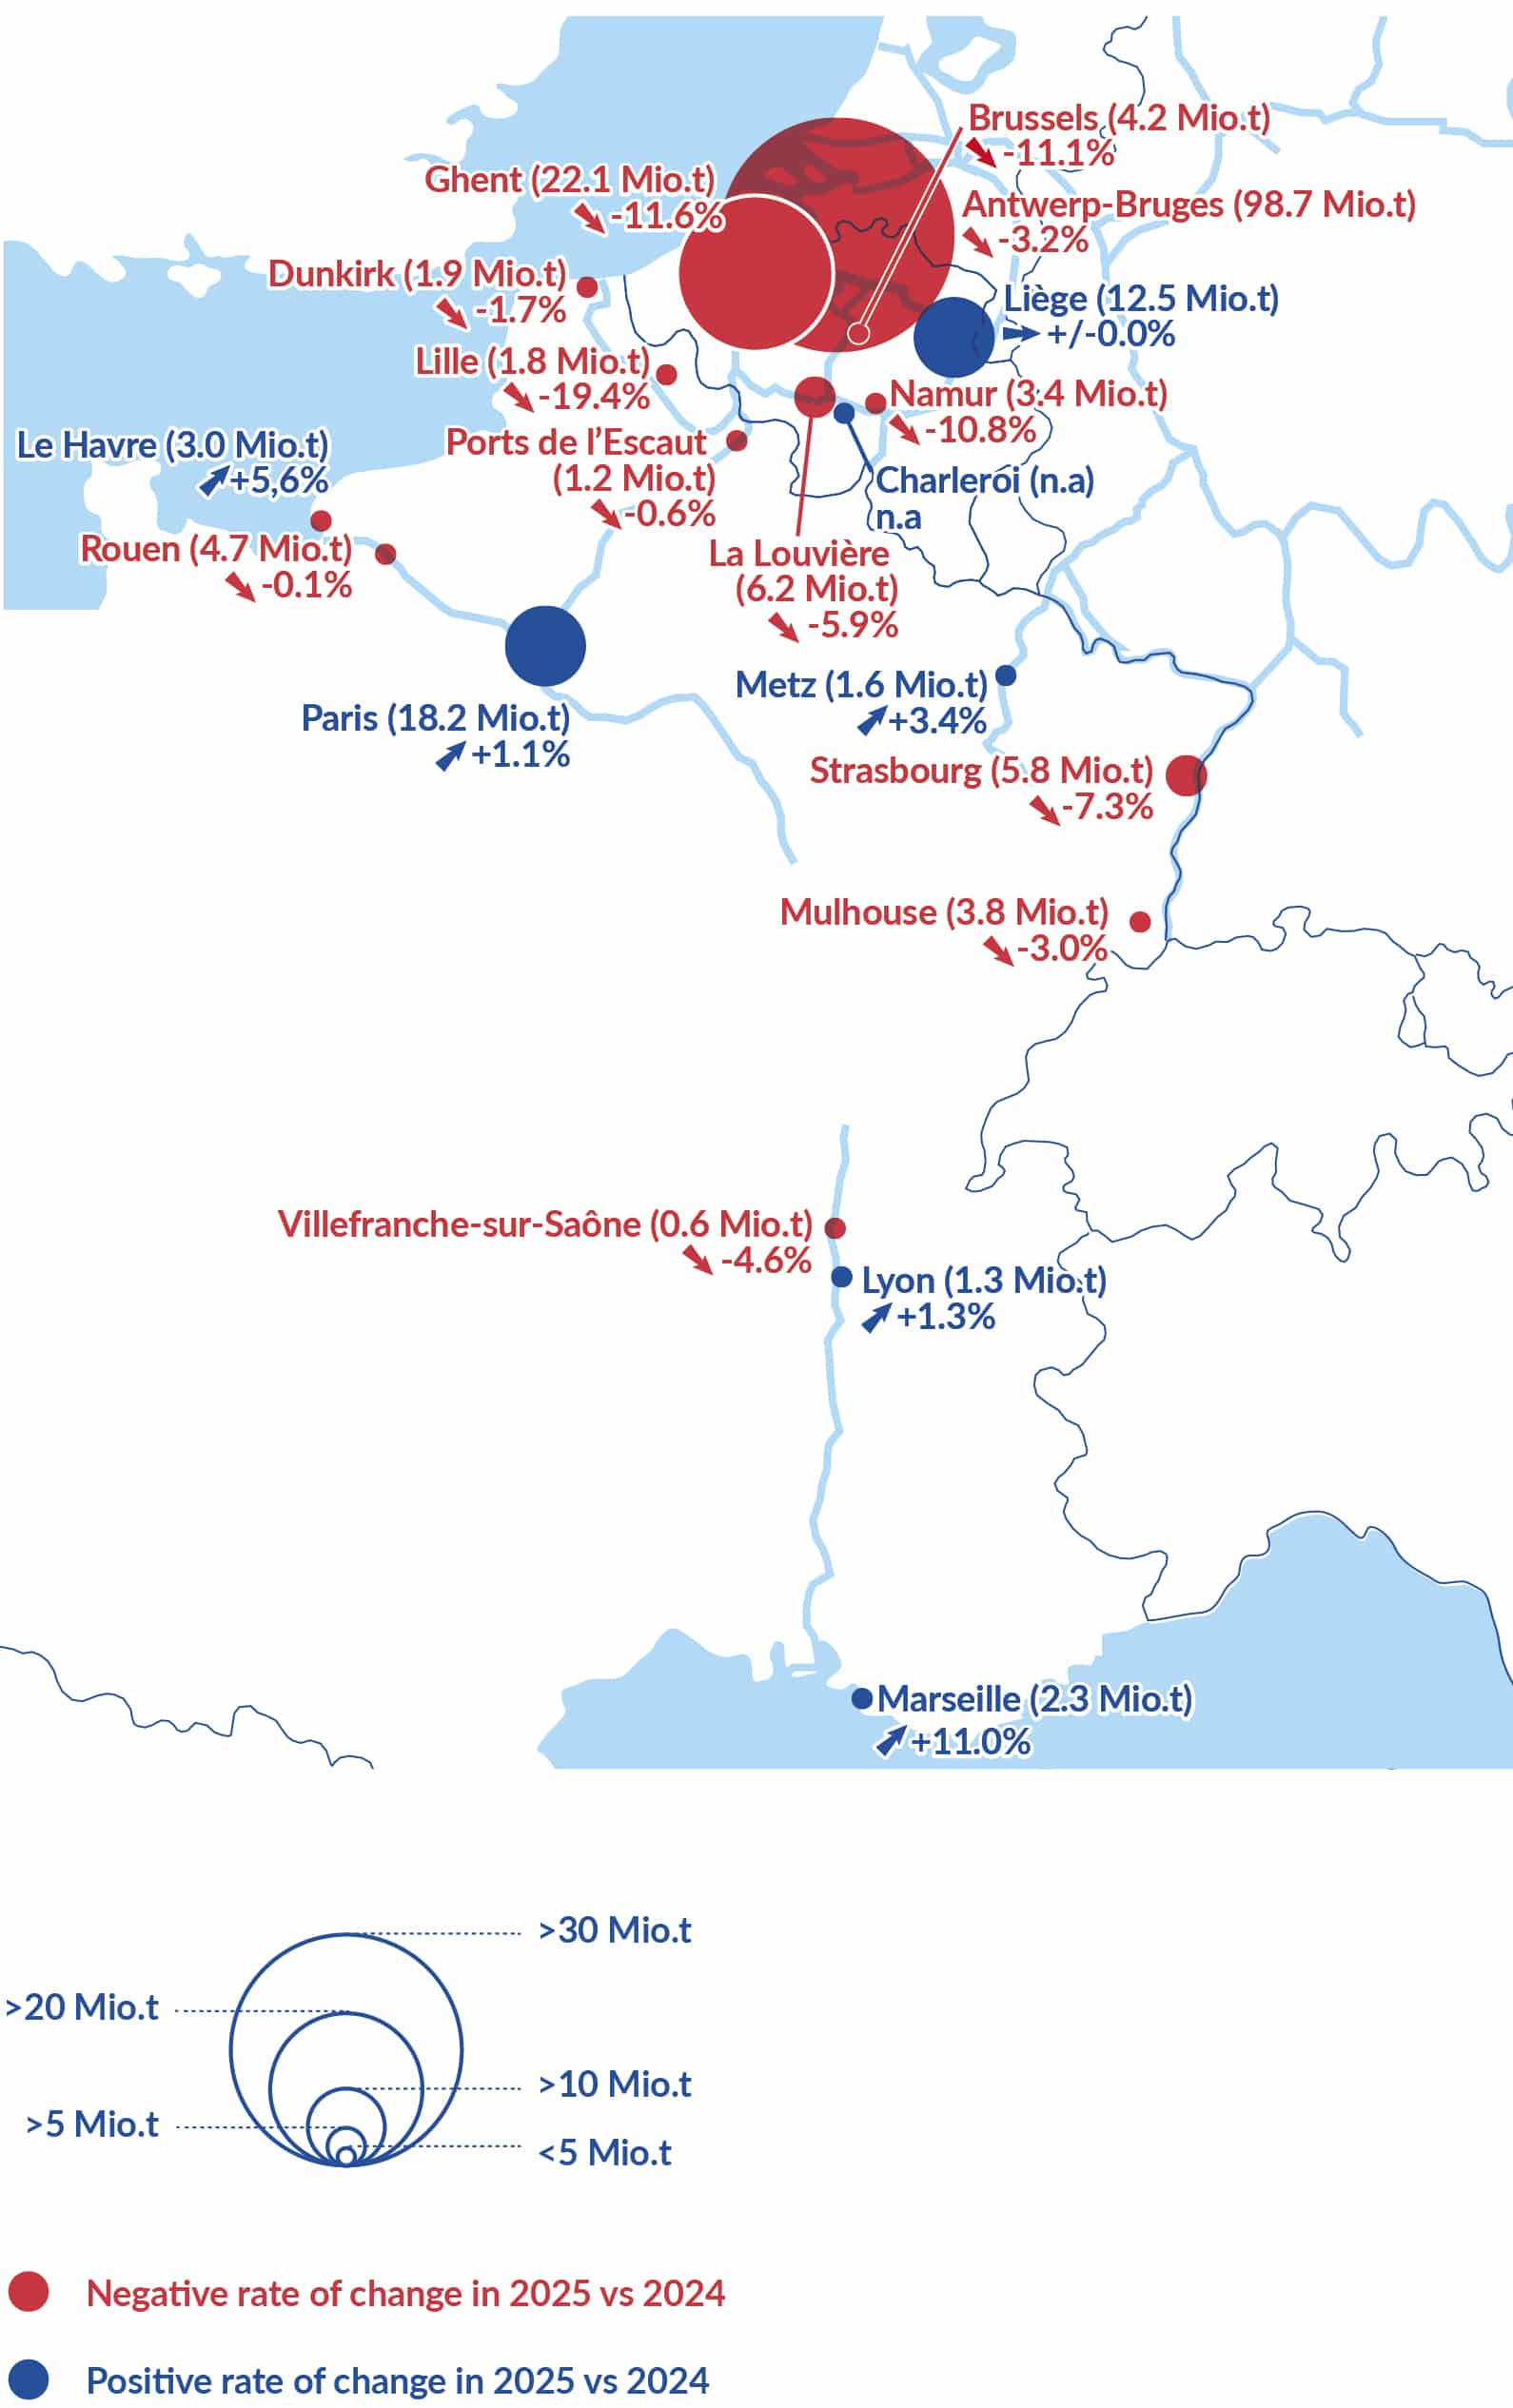
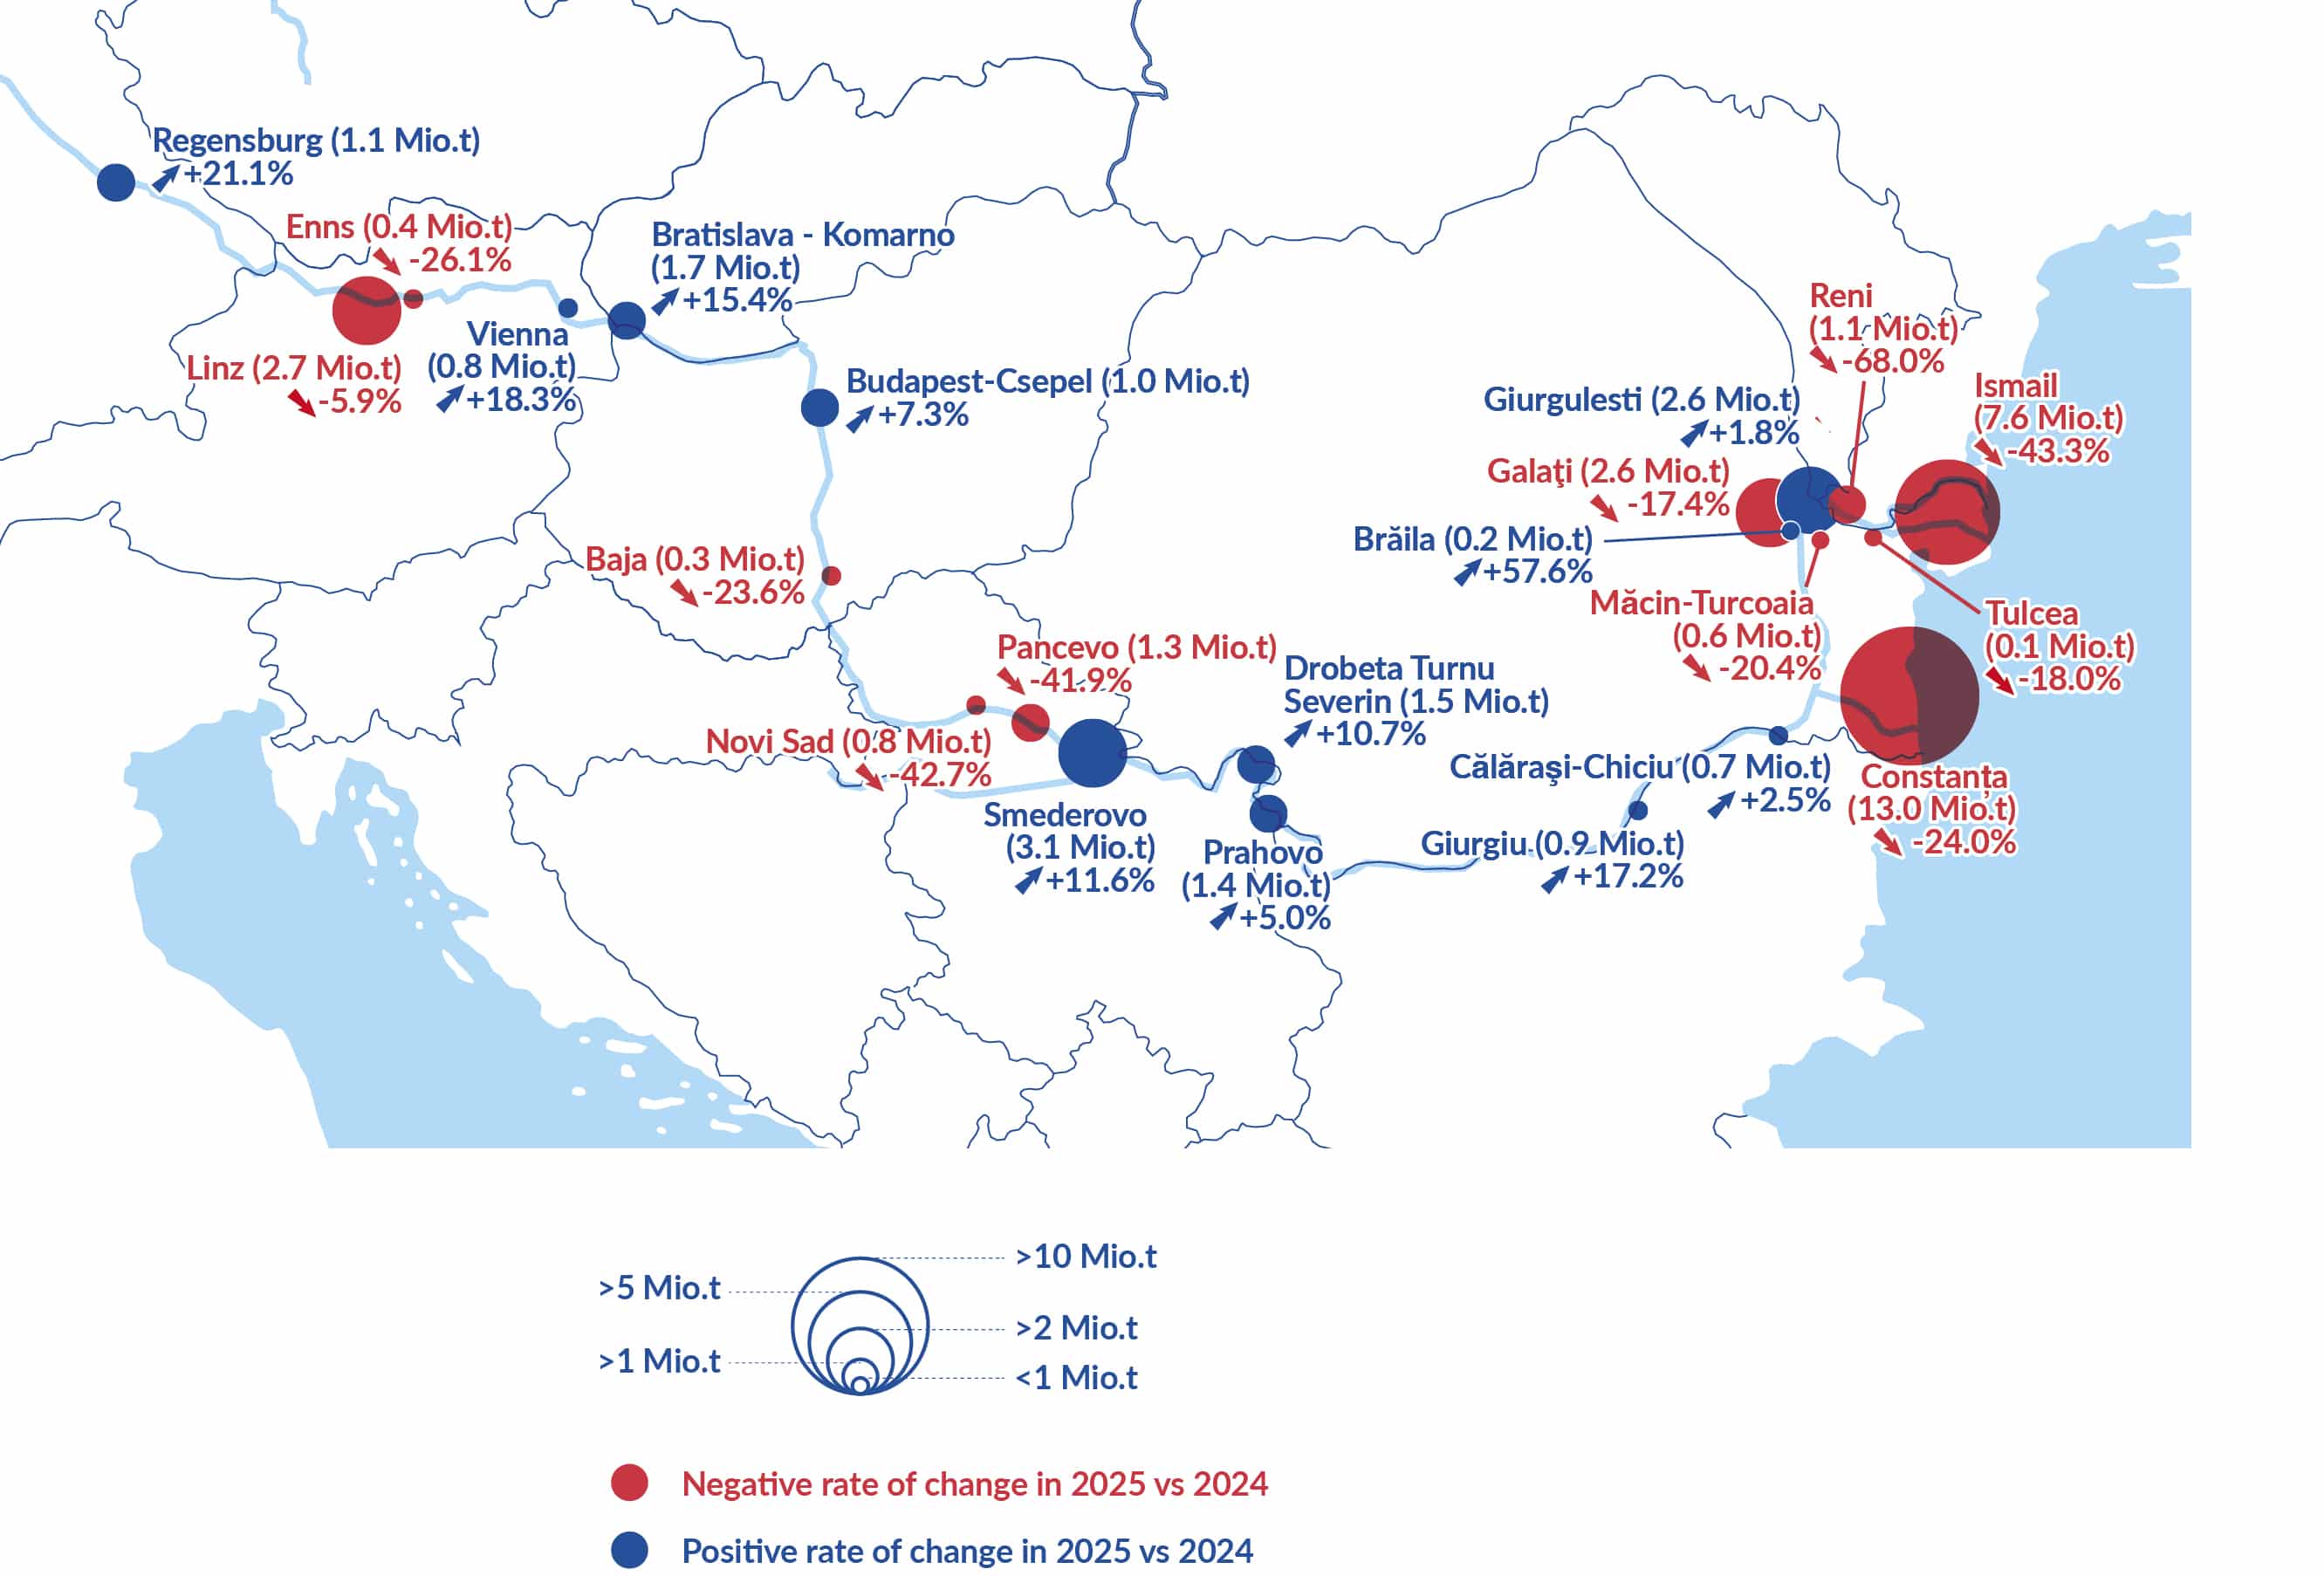
MAIN EUROPEAN INLAND AND SEAPORTS BY REGION21
-
Data related to inland waterway cargo handling in major inland and seaports is available in the statistical annex.
TRADITIONAL RHINE PORTS
-
TOTAL YEARLY WATERSIDE TRAFFIC (IN MILLION TONNES)
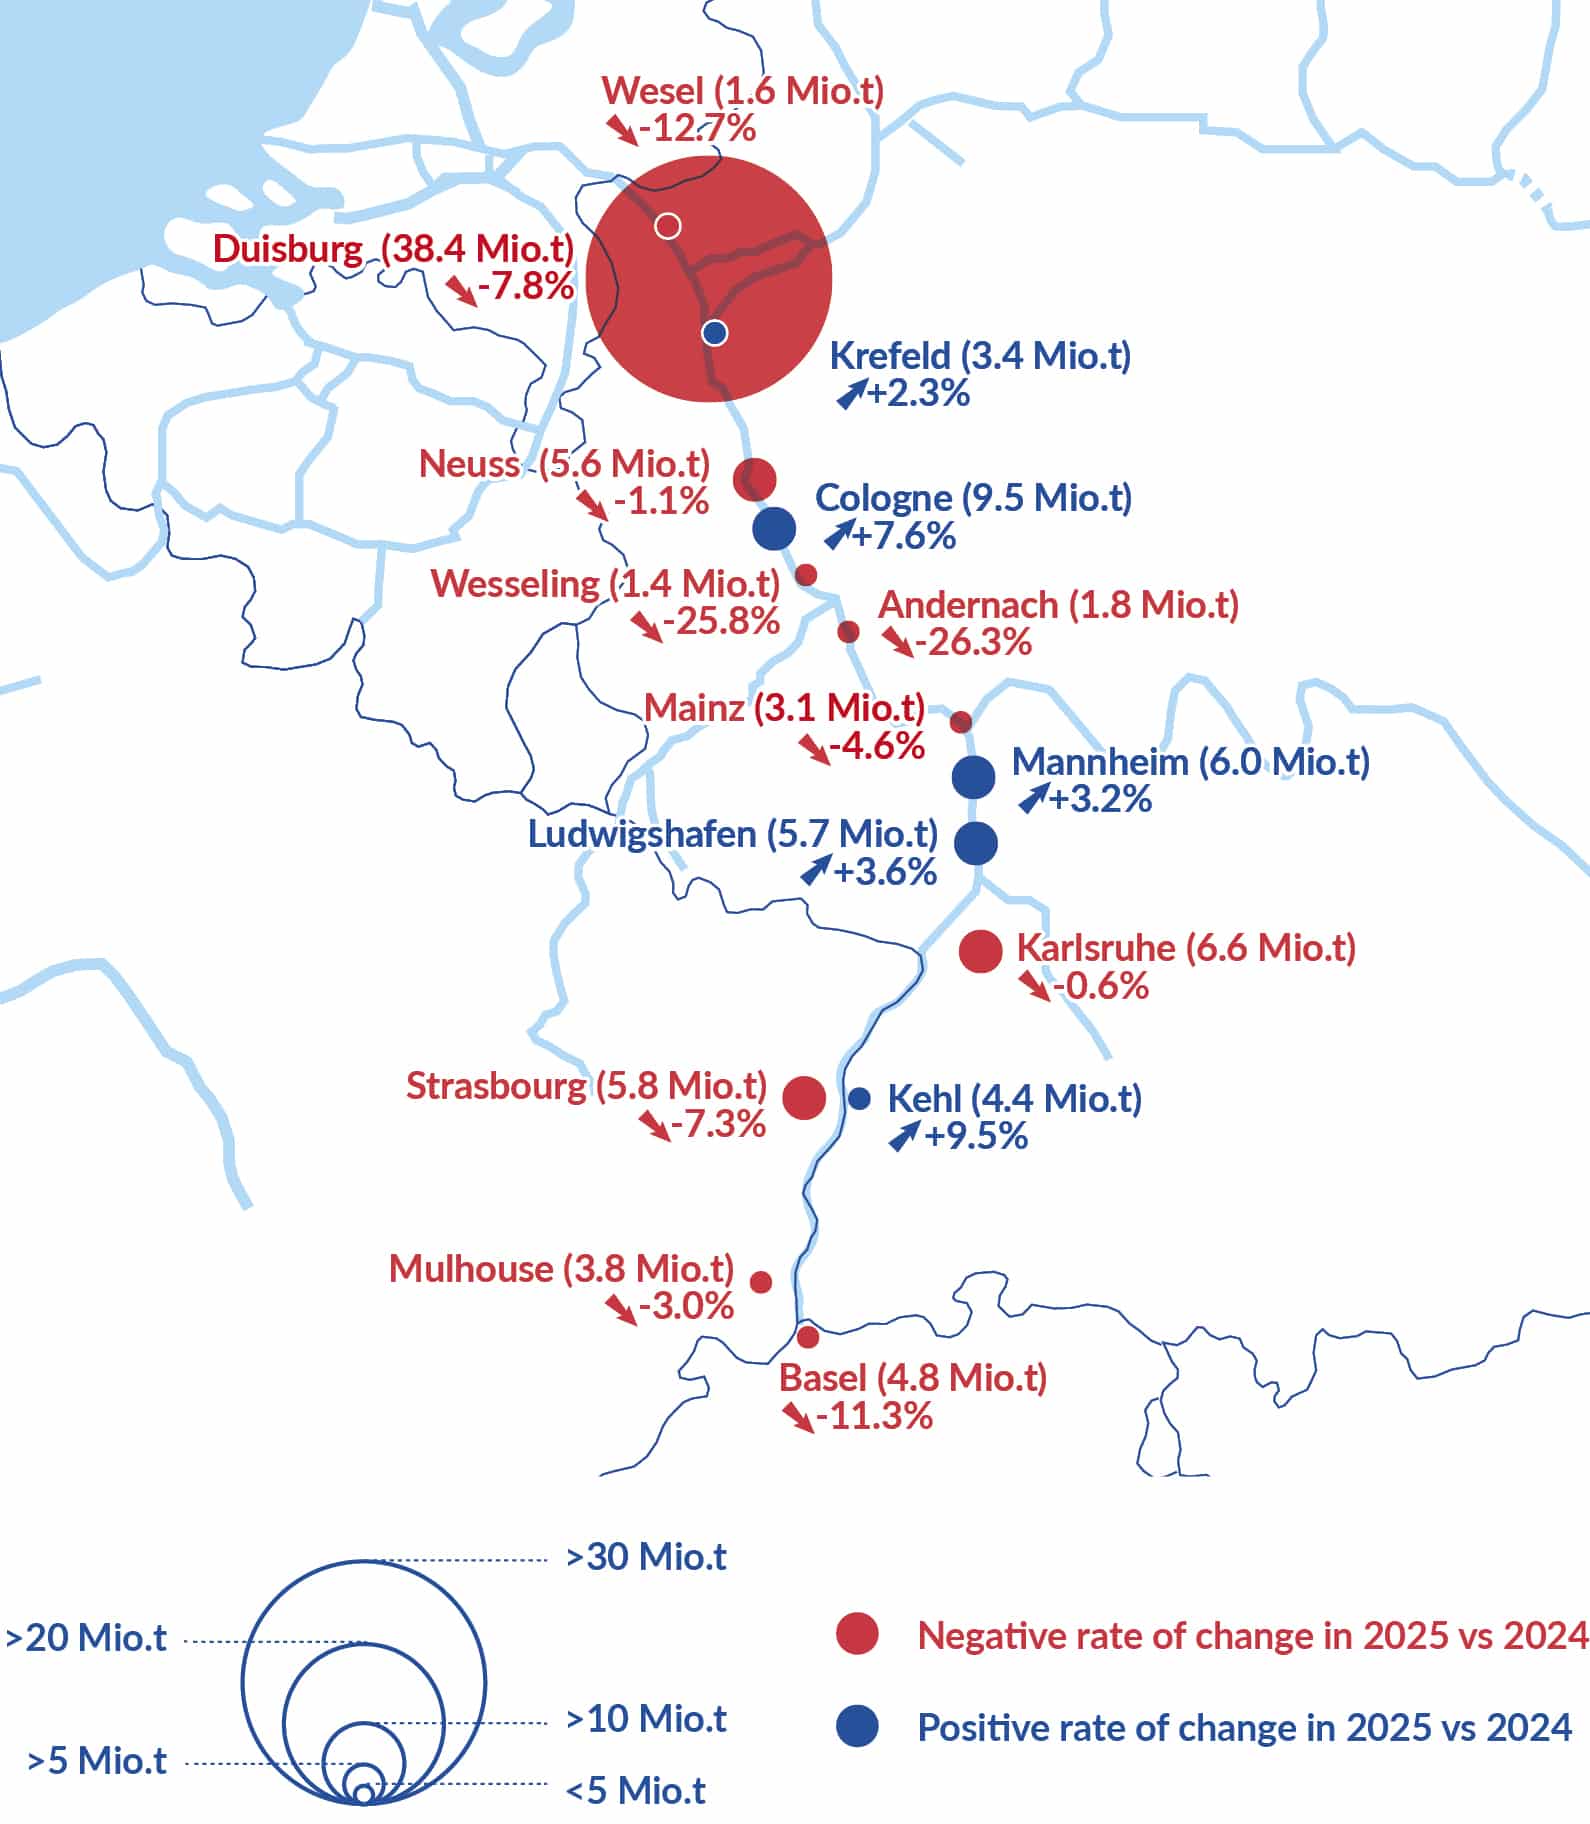
PORTS IN GERMANY OUTSIDE THE RHINE *
-
TOTAL YEARLY WATERSIDE TRAFFIC (IN MILLION TONNES)
DUTCH PORTS
-
TOTAL YEARLY WATERSIDE TRAFFIC (IN MILLION TONNES)
FRENCH AND BELGIAN PORTS
-
TOTAL YEARLY WATERSIDE TRAFFIC (IN MILLION TONNES)
DANUBE PORTS
-
TOTAL YEARLY WATERSIDE TRAFFIC (IN MILLION TONNES)
SAVA PORTS
-
TOTAL YEARLY WATERSIDE TRAFFIC (IN 1,000 TONNES)